
PET-460 · Lesson 12 of 12 · 19 min
Capstone: a storage hub project
Six months after Lena's first question, the study team gathered to assemble the answer for Prairie Crest's board. Ethan had the subsurface results, Sofia the pipeline and compression design, Gwen the capture estimates for each source, Amara the monitoring plan and Nadia the regulatory path and the draft contracts. Farid set the rule for the work. “The board will not read eleven reports. They want to know three things: can it be done safely, what does it cost and earn, and what do we have to decide now. Everything else is an appendix.” This lesson follows the team as it puts the pieces together into a development plan and a recommendation, using the methods of the previous lessons.
The scope
The Sturgeon Ridge carbon storage hub as studied has four parts. Capture is owned by the emitters: the Heartland hydrogen plant captures about 1.2 million tonnes a year from shifted syngas; the Northgate fertilizer plant compresses about 0.8 million tonnes a year from its high-purity vent; the Riverbend cement plant adds an amine plant on its kiln flue gas for about 0.6 million tonnes; and the Heartland cogeneration plant capture about 0.4 million tonnes from turbine exhaust. Transport, owned by Prairie Crest, consists of short laterals, compression at the larger sources, a central pump station and an NPS 16 trunk line 110 km long. Storage, also owned by Prairie Crest, is in the Basal Cambrian Sands at about 2,050 m, through four injectors that normally share the rate, any three of which can carry it, with two deep monitoring wells, four above-zone monitoring wells and the surface and seismic program of Lesson 10. The total is 3 million tonnes a year for 25 years, about 75 million tonnes, with the trunk line sized for growth to 5 million.
| Element | Basis | Lesson |
|---|---|---|
| CO₂ captured, avoided | 3.00 Mt/yr captured; 2.56 Mt/yr avoided | 1–3 |
| Stream specification | 95% CO₂ minimum, 50 ppmv water, 10 ppmv O₂ | 4 |
| Trunk line | NPS 16, 110 km, 15 to 13 MPa | 5 |
| Storage formation | Basal Cambrian Sands, 2,050 m, 45 m net, 16% porosity, 250 mD | 6 |
| Capacity (DOE, hub area) | 21 / 81 / 223 Mt at P10 / P50 / P90 | 8 |
| Wells | 4 injectors sharing the rate, any 3 able to carry it; 2 deep and 4 above-zone monitors | 8, 10 |
| Pressure at worst injector, 25 yr | 4.6 MPa against 12.7 allowed (open formation) | 9 |
| Transport and storage capital | 750 million CAD | 12 |
| Policy support per tonne | about 101 CAD (ITC and credits) | 11 |
Schedule and phases
Storage takes longest to prove, so the schedule starts there. Appraisal, covering 3D seismic, a stratigraphic test well, an injection test and laboratory work, takes about two years. Front-end engineering of the pipeline and storage facilities overlaps its second year. The regulatory application, for a carbon sequestration agreement and AER scheme approvals, follows the appraisal results, and approval is assumed to take about two years. Construction of the trunk line, pump station and wells takes about two years after a final investment decision. That puts first injection about six years from the start of appraisal, with the high-purity sources first and the flue gas sources joining as their capture plants are built. The emitters' own capture decisions run in parallel and must be timed so that CO₂ arrives as storage becomes ready; a hub with no CO₂ or CO₂ with no hub both lose money.
Economics of the hub
Prairie Crest's business is transport and storage, paid by a tariff per tonne. Its costs are the capital of the pipeline, pump station, wells and facilities; fixed operating costs, including monitoring; a stewardship levy per tonne; and closure costs at the end. The ITC returns 37.5 percent of the transport and storage capital in the first operating year. The code finds the tariff that gives a net present value of zero at an 8 percent real discount rate, the hub's NPV at the tariff offered to emitters, and the sensitivities.
# Transport-and-storage hub economics: break-even tariff, NPV at the offered tariff, and sensitivities.
# Real terms, 8% discount rate, local currency in millions. Illustrative numbers for the capstone.
SI = True      # True: Canadian hub (ITC on transport and storage capital), False: US hub (no ITC; emitters take 45Q)

if SI: P = dict(capex=750.0, itc=0.375, opex=24.0, mmv=6.0, closure=90.0, tariff=30.0, cur="million CAD", fund=0.5)
else:  P = dict(capex=700.0, itc=0.0, opex=22.0, mmv=6.0, closure=80.0, tariff=36.0, cur="million USD", fund=0.5)
R, LIFE = 0.08, 25
ramp = [1.5, 2.5] + [3.0] * (LIFE - 2)                 # Mt/yr injected in operating years 1..25

def npv(tariff, capex=None, vols=None, delay=0):
    capex = P['capex'] if capex is None else capex; vols = ramp if vols is None else vols
    cf = [-capex * 0.4, -capex * 0.6]                  # two construction years
    cf += [0.0] * delay
    for i, v in enumerate(vols):
        c = v * tariff - P['opex'] - P['mmv'] - v * P['fund']    # fund: post-closure stewardship levy per tonne
        if i == 0: c += capex * P['itc']               # ITC received in the first operating year
        cf.append(c)
    cf += [-P['closure'] / 3] * 3                      # three years of closure, plugging and monitoring
    return sum(c / (1 + R) ** t for t, c in enumerate(cf))

def breakeven(**kw):
    lo, hi = 0.0, 200.0
    for _ in range(60):
        mid = (lo + hi) / 2
        lo, hi = (mid, hi) if npv(mid, **kw) < 0 else (lo, mid)
    return (lo + hi) / 2

unit = "CAD/t" if SI else "USD/t"
print(f"Capital {P['capex']:.0f} {P['cur']}, ITC {P['itc']:.1%}, fixed costs {P['opex'] + P['mmv']:.0f} {P['cur']}/yr")
print(f"Break-even tariff: {breakeven():.1f} {unit}")
print(f"NPV at the offered tariff of {P['tariff']:.0f} {unit}: {npv(P['tariff']):,.0f} {P['cur']}")
print("\nSensitivities (break-even tariff):")
print(f"  capital +30%                          {breakeven(capex=P['capex'] * 1.3):6.1f} {unit}")
print(f"  capital -20%                          {breakeven(capex=P['capex'] * 0.8):6.1f} {unit}")
print(f"  one-year start-up delay               {breakeven(delay=1):6.1f} {unit}")
print(f"  smallest source never joins (2.6 Mt/yr) {breakeven(vols=[1.5, 2.2] + [2.6] * (LIFE - 2)):4.1f} {unit}")
print(f"  two sources only (1.8 Mt/yr)          {breakeven(vols=[1.2, 1.8] + [1.8] * (LIFE - 2)):6.1f} {unit}")
print(f"  third parties fill to 5 Mt/yr, year 8 {breakeven(vols=ramp[:7] + [5.0] * (LIFE - 7)):6.1f} {unit}")
# emitter's view: capture cost + tariff against the policy value per tonne (from Lesson 11)
cap_cost = 72.0 if SI else 55.0
for label, support in ((("whole project", 101.0),) if SI else (("credit years 1-12", 93.0), ("whole 25 years", 66.0))):
    m = support - cap_cost - P['tariff']
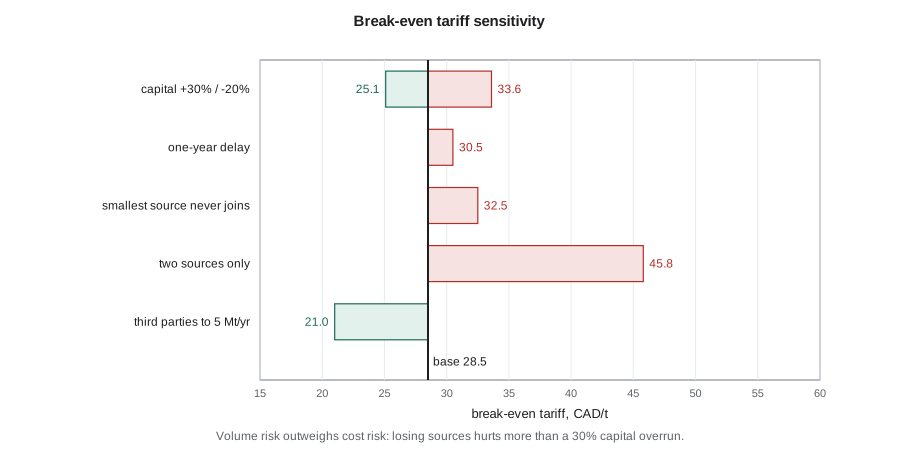
print(f"Emitter margin, {label}: support {support:.0f} - capture {cap_cost:.0f} - tariff {P['tariff']:.0f} = {m:+.0f} {unit}")Capital 750 million CAD, ITC 37.5%, fixed costs 30 million CAD/yr Break-even tariff: 28.5 CAD/t NPV at the offered tariff of 30 CAD/t: 43 million CAD Sensitivities (break-even tariff): capital +30% 33.6 CAD/t capital -20% 25.1 CAD/t one-year start-up delay 30.5 CAD/t smallest source never joins (2.6 Mt/yr) 32.5 CAD/t two sources only (1.8 Mt/yr) 45.8 CAD/t third parties fill to 5 Mt/yr, year 8 21.0 CAD/t Emitter margin, whole project: support 101 - capture 72 - tariff 30 = -1 CAD/t
The break-even tariff is about 28.5 Canadian dollars per tonne, and at the offered 30 the hub earns a modest positive NPV of about 43 million Canadian dollars. The sensitivities, shown in the tornado chart, tell the story the board needs to hear. Volume risk dominates: if only two sources join, the break-even tariff rises by about 60 percent, far more than the effect of a 30 percent capital overrun. Third-party volumes, filling the trunk line to 5 million tonnes a year from year 8, would cut the break-even by about a quarter. A one-year delay costs about two dollars per tonne.
The emitters' side is tighter. With support of about 101 dollars per tonne, a capture cost averaging 72 dollars and a 30-dollar tariff, the average emitter is close to break-even. The high-purity fertilizer and hydrogen sources are profitable; the cement and cogeneration flue gas sources, with capture costs well above the average, are not without a contract for difference. That asymmetry is the central commercial fact of the hub: the sources that make the hub viable are the cheap ones, and the expensive ones need more support than current policy reliably gives.
Worked problem
A simple levelized tariff
Check the break-even tariff with a levelized calculation. Transport and storage capital net of the ITC is 750 × (1 − 0.375) = 469 million. Fixed costs are 30 million a year, the levy or assurance is 0.5 per tonne, and steady throughput is 3.0 Mt/yr for 25 years. Use a capital recovery factor of 0.0937 for 8 percent over 25 years.
Show solution
- Annual capital charge = 469 × 0.0937 = 43.9 million.
- Annual cost = 43.9 + 30 = 73.9 million.
- Tariff = 73.9 / 3.0 + 0.5 = 25.1 per tonne.
Answer: About 25 Canadian dollars per tonne, lower than the code's 28.5 because the levelized calculation ignores the two construction years, the ramp-up and closure costs. Simple checks like this catch errors in a full cash flow model, but they flatter the project.
Risks
| Risk | Consequence | Mitigation |
|---|---|---|
| Storage capacity at the low end | too little room for 75 Mt in the hub area | test well and injection test before FID; reserve second area |
| A source does not build capture | break-even tariff rises by 15–60% | take-or-pay capacity contracts; seek third-party sources |
| Credit value lower than assumed | emitters cannot afford the tariff | contracts for difference |
| Permit delay | one year adds about 2 per tonne | early regulator engagement; complete application |
| Pressure interference from other projects | capacity and injection limits reduced | joint modelling with neighbours; brine extraction location reserved |
| Legacy well leakage | remediation cost, credit loss, reputation | well inventory, remediation before injection, above-zone monitoring |
| Community opposition | delays to pipeline and wells | early engagement, shared monitoring data, community benefits |
Farid insisted on ranking the risks by what the next stage could do about them. The capacity, injectivity and seal risks could be reduced quickly with a test well and seismic, at about 45 million Canadian dollars. The volume and credit risks could not be reduced by Prairie Crest at all; they depended on the emitters' decisions and on governments. That distinction shaped the recommendation.
The recommendation
The team's recommendation to the board was to proceed to appraisal, not to development. It asked for approval to shoot the 3D seismic survey, drill and test one stratigraphic well, complete the laboratory program and build the simulation model, at a cost of about 45 million Canadian dollars, over two years. In parallel, Nadia would negotiate capacity reservation agreements with the four sources, with a target of at least two signed take-or-pay agreements, including the Heartland hydrogen plant, before a decision to file for the sequestration agreement and begin front-end engineering. The final investment decision would require the test well to confirm a P50 capacity of at least 75 million tonnes in the hub area, signed agreements covering at least 2.4 million tonnes a year, and confirmation of the credit and contract for difference arrangements the emitters needed.
Lena asked one more question. “What would make you recommend stopping?” Ethan had prepared for it. “If the test well shows a much thinner or tighter Basal Cambrian than the regional data, or the seal has a sandy interval over a large area, or fewer than two sources sign, we stop and keep the data. The appraisal money buys the answer. It does not commit us to the rest.” The board approved the appraisal. That is how most storage projects begin: not with a decision to build, but with a decision to find out, staged so that each step reduces the largest remaining uncertainty for the least money.
Presenting the result
The team's board presentation followed a pattern worth copying. The first slide stated the recommendation and the cost of the next step. The next three gave the evidence on the three questions: the storage case, with the capacity range, pressure margin and seal; the economics, with the break-even tariff, the tornado chart and the emitters' margins; and the risks, with what the next stage would and would not resolve. The last slide set out the decision gates and the conditions for each. Every number on the slides could be traced to a calculation in the appendix, and every calculation stated its assumptions and range. A board that understands the uncertainty is more likely to fund the work that reduces it.
Common mistakes
MistakePresenting a single NPV without ranges or volume sensitivities.
InsteadShow the break-even tariff and its sensitivity to volume, capital, delay and price; volume often dominates.
MistakeCommitting to construction before storage is appraised.
InsteadStage the investment: appraisal first, with clear criteria for proceeding or stopping.
MistakeTreating the hub's economics apart from the emitters'.
InsteadCheck that each source can afford the tariff with its capture cost and policy support; the hub fails if they do not join.
MistakeHiding uncertainty to make the case look stronger.
InsteadState ranges and conditions; decision-makers fund well-defined uncertainty reduction.
Summary and key terms
- A storage hub plan combines capture by emitters with transport and storage by an operator paid through tariffs.
- Storage appraisal is the longest lead item and comes first in the schedule.
- The break-even tariff is most sensitive to volume; anchor contracts and third-party sources matter more than capital accuracy.
- Emitters' margins depend on capture cost, tariff and policy support; high-purity sources carry the early hub.
- The recommendation stages investment: appraisal with clear go and stop criteria before development.
- Transport and storage tariff
- The fee per tonne emitters pay the hub operator.
- Take-or-pay
- A contract under which the customer pays for reserved capacity whether or not it uses it.
- Break-even tariff
- The tariff that gives a net present value of zero at the chosen discount rate.
- Decision gate
- A planned point where the project proceeds, changes or stops based on set criteria.
- Anchor source
- An emitter whose committed volume makes a hub viable.
- Appraisal
- Work that reduces subsurface uncertainty before a development decision.
Practice problems
Work each problem on paper first, then reveal the answer to check.
Which sensitivity in the tornado chart has the largest effect, and what does it imply?
Show answer
Losing sources (two sources only); volume commitments must be secured before development.
Why might a high-purity source accept a tariff that a flue gas source cannot?
Show answer
Its capture cost is much lower, so the same support and tariff leave it a positive margin.
Name two criteria the team set for a final investment decision.
Show answer
P50 capacity of at least 75 Mt confirmed by the test well; signed agreements for at least 2.4 Mt/yr; confirmed credit arrangements.
Why does the levelized tariff come out lower than the cash flow model's break-even?
Show answer
It ignores construction years, ramp-up and closure costs.
Lesson quiz · 5 questions
Score 60% or more to complete this lesson.
Create a free account to save your progress, take quizzes and earn a certificate.