
PET-350 · Lesson 6 of 12 · 19 min
Neutron and sonic logs
The neutron curve on the 100/08-27 delineation well print tracks the density curve closely through most of the Cardium, then pulls sharply away from it over the top few metres. Ethan points at the gap. 'That,' Imogen says, 'is the most famous pattern in log analysis. When the neutron porosity reads low and the density porosity reads high, you are usually looking at gas. The question is whether it is free gas, or just gas that came out of solution in the flushed zone near the well.'
This lesson covers the two other porosity tools. The neutron tool measures hydrogen content; the sonic tool measures how fast sound travels through the rock. Each responds to porosity in its own way and to lithology, shale and fluids differently from the density, which is why the three are run together. The lesson explains how each tool works, how neutron and density are combined in crossplots and to detect gas, and how sonic porosity is calculated and used.
How the neutron tool works
The neutron tool carries a sealed neutron source, traditionally a mixture of americium and beryllium, or a pulsed electronic neutron generator. Fast neutrons leaving the source collide with nuclei in the borehole and formation and lose energy with each collision. Hydrogen is by far the most effective at slowing neutrons, because a hydrogen nucleus has almost the same mass as a neutron and takes up a large share of its energy in each collision. After slowing to low, or thermal, energies, neutrons wander until they are captured by a nucleus.
Detectors at two distances from the source count slowed neutrons or the gamma rays emitted at capture. In rock with a lot of hydrogen, neutrons slow down close to the source and few reach the far detector. In rock with little hydrogen, they travel further. The ratio of the two count rates is converted to an apparent porosity called the neutron porosity, on the assumption that all the hydrogen is in pore water.
The neutron tool is usually calibrated to read true porosity in water-filled limestone. On other lithologies it needs a correction: in sandstone it reads a few porosity units low, and in dolomite a few porosity units high, relative to true porosity. Prints therefore label the neutron curve with its matrix, most often limestone units.
What the neutron sees besides porosity
The neutron responds to all hydrogen, not only pore water. Shale contains bound water in clay minerals and reads a high neutron porosity, often 30 to 45 percent, even though its effective porosity is very small. This makes the neutron read high in shaly rock and is one reason neutron and density curves separate in shale. Gypsum and some other minerals with water in their structure also read high.
Gas has a much lower hydrogen density than water or oil. In a gas zone, the flushed zone still holds some residual gas, so the neutron reads lower than the true porosity. This is the opposite of the density, which reads too high in gas. The combination produces the classic gas crossover, where the neutron porosity falls below the density porosity on a compatible scale.
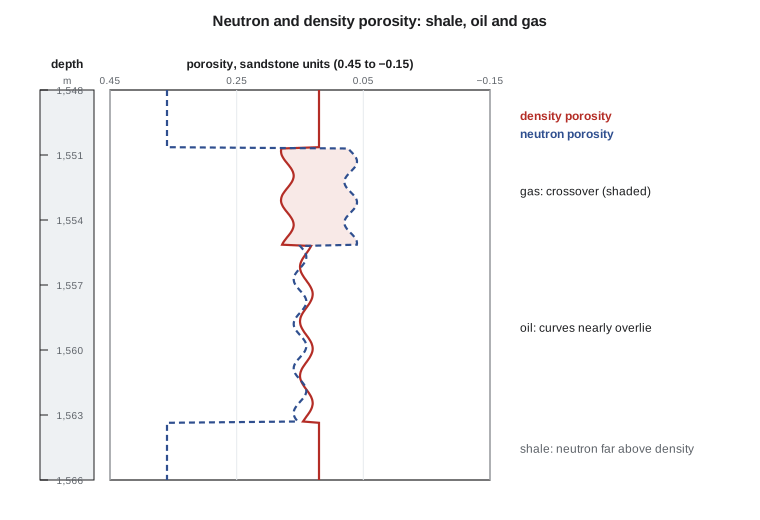
Light oil and condensate have hydrogen densities close to water and cause little neutron effect. Salty water has slightly less hydrogen than fresh water and so a slightly smaller neutron response, a small correction usually handled in processing. The neutron reads a little deeper than the density, but both mostly see the flushed zone.
Combining neutron and density
Plotted against each other, neutron porosity and bulk density define lines for each pure lithology, with porosity increasing along each line. A water-filled rock plots on or between the lithology lines, and its position gives both the porosity and a lithology estimate that is largely independent of the matrix choice. This neutron-density crossplot is one of the most useful single tools in log analysis.
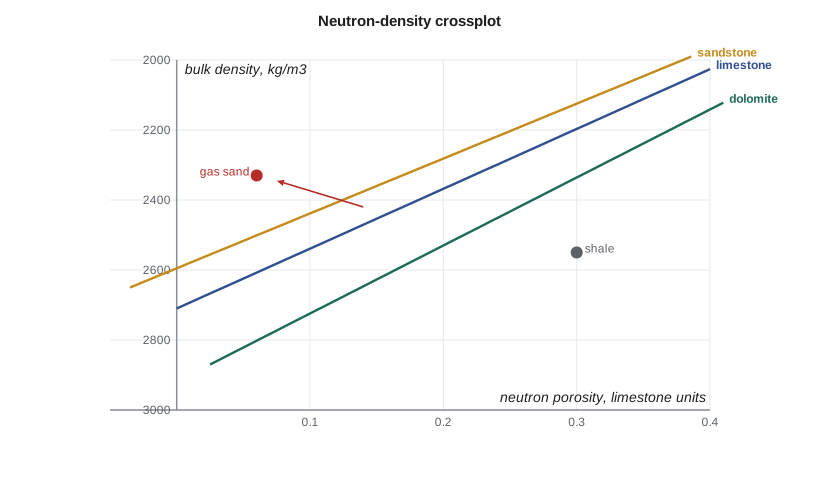
In practice, a rock between the sandstone and limestone lines may be a sandstone with some calcite cement or a limestone with some quartz. Shale moves points toward the lower right, toward higher neutron and higher density. Gas moves points toward the upper left. Interpreters use these shifts both to identify problems and to correct for them.
In gas-bearing rock, a common practical correction combines the two readings as a root-mean-square average, which partly cancels the opposite errors.
The formula is empirical but works reasonably well when the gas effect is moderate and the matrix is known. More rigorous methods iterate on the flushed-zone gas saturation, but give similar answers in most cases.
Is it really gas?
The crossover at the top of the Cardium in the 100/08-27 delineation well worries Lena, because the Cardium A pool has been produced for years and its pressure may have fallen below the bubble point near the old wells. If so, gas has come out of solution in the reservoir and may have formed a secondary gas cap. Imogen points out another possibility: in a very light oil, gas can come out of solution in the flushed zone only, as filtrate displaces oil and pressure near the well drops slightly. The two cases look similar on logs. The formation pressure tests in lesson 10 and the fluid samples will decide. For the moment, Ethan corrects the porosity with the root-mean-square formula and flags the interval as possible gas.
The sonic tool
The sonic tool sends sound pulses from transmitters into the borehole and records the arrival of the waves at receivers spaced along the tool. Part of the energy travels through the formation along the borehole wall as a refracted compressional wave, and its arrival time at successive receivers gives the formation's compressional slowness, the interval transit time, written Δt.
Canadian logs commonly record slowness in microseconds per metre; for example, about 182 µs/m for sandstone matrix and about 620 µs/m for water. Faster, denser and less porous rocks have smaller transit times.
Modern dipole sonic tools also measure shear waves, even in slow formations where conventional tools cannot. Shear slowness, together with compressional slowness and density, gives the rock's elastic properties such as Poisson's ratio and Young's modulus, which completion engineers use to estimate stress and to design fractures (PET-330). Comparing fast and slow shear directions reveals stress anisotropy and aligned fractures.
Sonic porosity
The simplest relation is Wyllie's time-average equation, which assumes the transit time is a volume-weighted average of the matrix and fluid transit times.
The time-average equation works best in consolidated rocks with intergranular porosity. In poorly compacted rocks it overestimates porosity, and an empirical compaction factor is often applied. Raymer, Hunt and Gardner proposed a different relation, derived from field data, that fits many sandstones better over a wide range of porosity; a simplified form is
# Neutron-density porosity (with gas) and sonic porosity by Wyllie and Raymer-Hunt-Gardner
import math
SI = True
phi_n, phi_d = 0.07, 0.17           # limestone-unit neutron and sandstone density porosity in a gas zone
phi_nd = math.sqrt((phi_n ** 2 + phi_d ** 2) / 2)
print(f"neutron {phi_n:.2f}, density {phi_d:.2f}: gas crossover; root-mean-square porosity {phi_nd:.3f}")
if SI: dt, dtma, dtf, u = 248.0, 182.0, 620.0, "µs/m"
else:  dt, dtma, dtf, u = 75.5, 55.5, 189.0, "µs/ft"
wyllie = (dt - dtma) / (dtf - dtma)
rhg = 0.625 * (dt - dtma) / dt        # simplified Raymer-Hunt-Gardner form
print(f"sonic {dt} {u}: Wyllie porosity {wyllie:.3f}, Raymer-Hunt-Gardner porosity {rhg:.3f}")
print(f"difference from the density porosity of 0.140: Wyllie {wyllie - 0.14:+.3f}, Raymer-Hunt-Gardner {rhg - 0.14:+.3f}")neutron 0.07, density 0.17: gas crossover; root-mean-square porosity 0.130 sonic 248.0 µs/m: Wyllie porosity 0.151, Raymer-Hunt-Gardner porosity 0.166 difference from the density porosity of 0.140: Wyllie +0.011, Raymer-Hunt-Gardner +0.026
The program shows that a gas-affected neutron of 7 percent and density of 17 percent give a root-mean-square porosity of 13 percent. In the liquid-filled part of the same sand, the sonic gives 15.1 percent by Wyllie and 16.6 percent by the simplified Raymer-Hunt-Gardner relation, against a density porosity of 14 percent. The Wyllie result is closer here; the choice should be calibrated against core.
What the sonic misses, and why that helps
Sound travels along the fastest path, which in most rocks is the continuous framework of grains. Isolated vugs and fractures that do not lie on that path barely change the transit time. The sonic therefore tends to measure intergranular or matrix porosity and to miss much of the secondary porosity. Lesson 9 turns this weakness into a tool: the difference between total porosity from neutron-density and sonic porosity gives a secondary porosity index.
Gas also slows sound noticeably in poorly consolidated rocks, so sonic porosity can read high in shallow gas sands, but the effect is small in well-consolidated rock. Washouts and fractures can cause the waveform processing to pick the wrong arrival, a problem called cycle skipping that shows as sudden spikes on the curve.
The seismic tie
Sonic and density logs together give acoustic impedance, the product of velocity and density, at every depth. Changes in impedance create seismic reflections. Geophysicists use the logs to build synthetic seismograms that tie the well to the seismic data and calibrate seismic attributes such as amplitude to porosity or fluid. This tie is how reservoir properties measured at a handful of wells are extended across a field.
Worked problem
Choosing the porosity
In a liquid-filled sandstone, density porosity is 0.12, neutron porosity on a sandstone matrix is 0.13 and Wyllie sonic porosity is 0.12. In a gas-bearing interval above, density porosity is 0.18 and neutron porosity is 0.08. What porosity should be used in each?
Show solution
- In the liquid zone the three tools agree within a porosity unit; use the density, about 0.12, as the most precise.
- In the gas zone the readings cross over, so a gas correction is needed.
- Root-mean-square porosity = √((0.08² + 0.18²)/2) = √((0.0064 + 0.0324)/2) = √0.0194 = 0.139.
Answer: Use about 0.12 in the liquid zone and about 0.14 in the gas zone.
Kinds of neutron tool
Neutron tools differ in what they count. Thermal neutron tools count neutrons that have slowed to thermal energies; they are the most common, but their readings are affected by elements that capture thermal neutrons strongly, such as chlorine in salty water, boron and gadolinium in some clays. Epithermal tools count neutrons that are slowed but not yet thermal, which reduces the effect of these absorbers and gives a reading closer to the true hydrogen index, though with lower count rates and more noise. Pulsed neutron tools replace the chemical source with an electronic generator and, besides porosity, can measure the capture cross section of the formation, which responds to chlorine in water and is used to monitor saturation behind casing (lesson 10). For a petrophysicist, the practical point is to know which kind of neutron was run and which corrections were applied, because the same rock can read a few porosity units differently on different tools.
Choosing porosity in shaly rock
In shaly sands the three porosity tools respond to clay differently. The neutron reads high because of bound water. The density reads according to the clay's grain density, which is often close to or above that of quartz, so it is less affected. The sonic slows down in clay-rich rock and reads high. For this reason the density, corrected for shale volume, is usually the preferred porosity in shaly sands, while the neutron-density separation is used as a shale indicator. In gas-bearing shaly sands, the gas and shale effects on the neutron oppose each other and can cancel, hiding the gas; the crossover then disappears, and NMR, sonic and formation tests become important for spotting gas.
Common mistakes
MistakeReading neutron porosity in limestone units as true porosity in sandstone.
InsteadConvert to the correct matrix; limestone-scaled neutrons read low in sandstone.
MistakeTreating neutron-density separation in shale as gas.
InsteadShale moves the neutron above the density; gas does the opposite.
MistakeAssuming crossover always means free gas in the reservoir.
InsteadIt can mean gas in the flushed zone only; confirm with pressures and samples.
MistakeUsing the Wyllie relation in poorly compacted rock without correction.
InsteadApply a compaction correction or a relation calibrated to core.
MistakeExpecting the sonic to see vugs and fractures.
InsteadThe sonic sees mainly matrix porosity; use the difference to estimate secondary porosity.
Summary and key terms
- The neutron tool measures hydrogen content and is usually calibrated in limestone units.
- Shale reads high on the neutron because of bound water; gas reads low because of its low hydrogen density.
- Neutron and density together give porosity and lithology from a crossplot, and they detect gas by crossover.
- A root-mean-square average of neutron and density porosity is a practical gas correction.
- The sonic measures compressional and shear slowness; Wyllie and Raymer-Hunt-Gardner relations give porosity.
- The sonic sees mainly matrix porosity, gives rock mechanical properties and ties the well to seismic.
- Neutron porosity
- An apparent porosity from the slowing of neutrons by hydrogen.
- Gas crossover
- The pattern where neutron porosity reads below density porosity because of gas.
- Neutron-density crossplot
- A plot of neutron porosity against bulk density used to find porosity and lithology.
- Interval transit time
- The time sound takes to travel a unit length of formation.
- Dipole sonic
- A sonic tool that measures shear-wave slowness in slow and fast formations.
- Acoustic impedance
- The product of a rock's density and its sound velocity.
Practice problems
Work each problem on paper first, then reveal the answer to check.
Why is hydrogen so effective at slowing neutrons?
Show answer
Its nucleus has nearly the same mass as a neutron.
Which way does gas move a point on a neutron-density crossplot?
Show answer
Up and to the left: lower neutron, lower density.
Why does the sonic miss isolated vugs?
Show answer
Sound travels fastest through the continuous grain framework.
What do completion engineers use shear slowness for?
Show answer
Elastic properties and stress estimates for fracture design.
Lesson quiz · 5 questions
Score 60% or more to complete this lesson.
Create a free account to save your progress, take quizzes and earn a certificate.