
PET-350 · Lesson 3 of 12 · 20 min
Spontaneous potential and gamma ray logs
Imogen starts Ethan on the simplest curves on the print: the gamma ray and the spontaneous potential in track 1. 'Most of the time these are the first two curves anyone looks at,' she says. 'They tell you where the shale is, they let you correlate with every other well in the field, and the SP can even give you the salinity of the formation water if the conditions are right. Learn to read them before you look at anything fancier.'
This lesson explains how the spontaneous potential and gamma ray logs work, how they are used to separate reservoir rock from shale and to estimate the volume of shale, how the spontaneous potential gives the formation water resistivity, and where both curves can mislead.
The spontaneous potential
The spontaneous potential, or SP, is the voltage between an electrode in the borehole and a reference electrode at surface. No current is sent into the formation; the SP records natural voltages that arise where mud filtrate and formation water of different salinities meet across shale and permeable rock. Because it needs a conductive path, it is recorded only in water-based mud.
Two electrochemical effects produce most of the SP. Shale behaves like a membrane that lets positive sodium ions through more easily than negative chloride ions, so a voltage develops across the shale between salty formation water on one side and fresher mud on the other. This membrane potential is the larger effect. A second, smaller liquid junction potential develops where filtrate and formation water meet directly in the permeable rock, because chloride ions diffuse faster than sodium ions. Together they drive a small current through the mud, the shale and the permeable bed, and the SP electrode measures the voltage drop of that current in the borehole.
On the log, the SP is read against a shale baseline, a nearly straight line through the readings opposite thick shales. Opposite clean permeable rock, the SP deflects away from the baseline. When the formation water is saltier than the mud filtrate, the usual case, the deflection is negative, to the left on standard scales. When the filtrate is saltier, the deflection reverses. When the two have similar salinity, the SP is almost featureless.
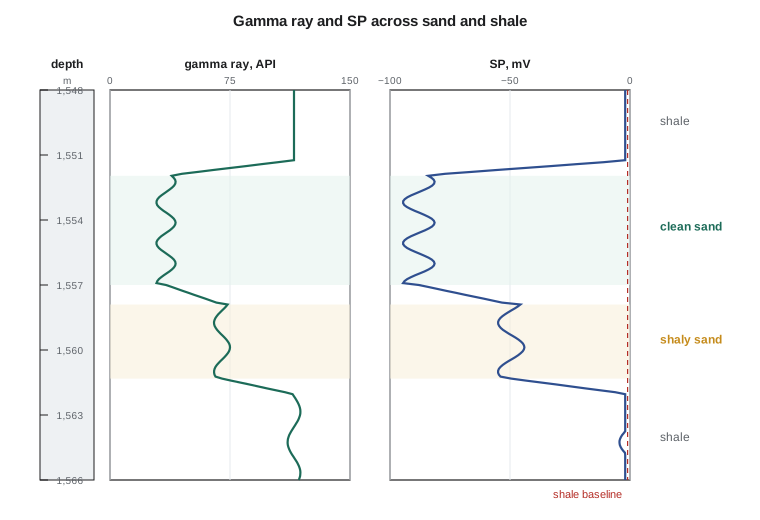
The full deflection, the static SP or SSP, is the value the SP would read in a thick clean water-bearing bed if no current were lost. Thin beds, shaly beds and hydrocarbon-bearing beds all show smaller deflections. The SP is therefore most useful in thick, clean, water-bearing sands, where it can be read cleanly.
Formation water resistivity from the SP
In a clean water-bearing bed, the static SP is related to the ratio of the equivalent resistivities of the mud filtrate and the formation water.
The equivalent resistivities correct for the fact that solutions do not behave ideally at high salinity. For fairly fresh filtrates a common rule is Rmfe = 0.85 Rmf at formation temperature. Converting Rwe back to Rw uses a chart for saline waters; for moderate salinities Rw is close to Rwe. The method gives a value of formation water resistivity, Rw, directly from the logs, which is valuable because Rw appears in every saturation calculation in lesson 7.
# Shale volume from gamma ray (linear and Larionov) and water resistivity from the SP
import math
SI = True
gr_clean, gr_shale = 28.0, 128.0
readings = [(1551.0 if SI else 10446.0, 34.0), (1554.0 if SI else 10452.0, 52.0),
            (1558.0 if SI else 10458.0, 75.0), (1562.0 if SI else 10464.0, 104.0)]
du = "m" if SI else "ft"
print("depth      GR   IGR   Vsh linear  Vsh Larionov (older rocks)")
for d, g in readings:
    igr = (g - gr_clean) / (gr_shale - gr_clean)
    lar = 0.33 * (2 ** (2 * igr) - 1)
    print(f"{d:8,.0f} {du} {g:5.0f} {igr:5.2f}   {igr:8.2f}   {lar:8.2f}")
# Rw from the static SP in a clean water sand: SSP = -K log10(Rmfe/Rwe)
T_f = 141.0 if SI else 242.0      # formation temperature in degrees F (60.5 C on the Canadian well), used in K
K = 61 + 0.133 * T_f
ssp = -71.0 if SI else -60.0       # mV, read against the shale baseline
rmf = 0.409 if SI else 0.231       # filtrate resistivity at formation temperature, ohm·m (from lesson 2)
rmfe = 0.85 * rmf                   # common rule: Rmfe = 0.85 Rmf for fairly fresh filtrates
rwe = rmfe / 10 ** (-ssp / K)
print(f"K = {K:.1f} mV per decade; SSP = {ssp:.0f} mV")
print(f"Rmfe = {rmfe:.4f} ohm·m -> Rwe = {rwe:.4f} ohm·m, so Rw is about {rwe:.3f} ohm·m")depth GR IGR Vsh linear Vsh Larionov (older rocks) 1,551 m 34 0.06 0.06 0.03 1,554 m 52 0.24 0.24 0.13 1,558 m 75 0.47 0.47 0.30 1,562 m 104 0.76 0.76 0.62 K = 79.8 mV per decade; SSP = -71 mV Rmfe = 0.3476 ohm·m -> Rwe = 0.0448 ohm·m, so Rw is about 0.045 ohm·m
For the 100/08-27 delineation well, the static SP in the thick clean water sand below the oil zone is about −71 mV. With the filtrate resistivity of 0.41 ohm·m from lesson 2 and a formation temperature of 60.5 °C (141 °F, the unit the K formula uses), the program gives Rw of about 0.045 ohm·m. Imogen compares it with the value from the produced water analysis of nearby wells, which lies close to that figure, and adopts 0.045 ohm·m for the interpretation.
Other ways of finding Rw are a produced water sample analysed in a lab, a value from a regional water catalogue, and the Pickett plot of a water-bearing interval, which lesson 7 develops. Each has its weaknesses: samples may be contaminated with filtrate or completion fluid, catalogues may not fit a particular pool, and the SP needs a clean, thick water sand and a good salinity contrast. Where several methods agree, confidence is high.
The gamma ray
The gamma ray tool counts natural gamma rays emitted by the rock. The radioactivity of sedimentary rocks comes mainly from three sources: potassium-40, and the decay series of thorium and uranium. Clay minerals contain potassium and adsorb thorium, and organic matter tends to concentrate uranium. Clean quartz sandstone and pure limestone have little of any of these, so they read low; shales read high. The gamma ray is therefore the standard shale indicator, recorded in American Petroleum Institute units (API units) calibrated in a test pit.
The gamma ray works in any mud, through casing and cement (with reduced counts), and with good vertical resolution of about 30 to 60 cm, or one to two feet. It is run on almost every tool string and is the standard curve for correlating between wells and for depth matching between runs, as lesson 1 showed.
Gamma ray readings are statistical. The tool counts individual gamma rays, so the reading fluctuates even opposite uniform rock. Slower logging speeds and filtering reduce the noise. Borehole conditions also affect the readings: larger holes, heavy mud and potassium chloride in the mud all change the count, and corrections are applied in processing.
Shale volume from the gamma ray
The gamma ray index scales the reading between a clean baseline and a shale baseline chosen from the log.
In the simplest approach the shale volume equals the gamma ray index. Field studies found that this overestimates shale volume in many rocks, so nonlinear relations are often used. Larionov proposed two forms, one for young unconsolidated rocks and one for older consolidated rocks; the older-rock form, used for the Cardium, is
The program shows the difference. At an index of 0.47 the linear method gives 47 percent shale while the Larionov older-rock form gives 30 percent. The choice matters, because shale volume feeds directly into the shaly-sand saturation equations of lesson 8 and into the net pay cutoffs of lesson 12. Imogen's practice is to calibrate the method against core descriptions and X-ray diffraction measurements of clay content from the 08-27 core, rather than choosing it by habit.
The clean and shale baselines must be picked with care. The clean line comes from the cleanest reservoir rock in the interval, not from an anomalously low reading in a single bed. The shale line comes from a representative thick shale near the reservoir, not from a highly radioactive organic shale. Where shale character changes with depth, the baselines are picked zone by zone.
Spectral gamma ray
A spectral gamma ray tool measures the energy of each gamma ray and separates the counts into potassium, thorium and uranium contributions. This helps in several ways. It identifies clay types, since different clays have characteristic thorium-to-potassium ratios. It finds radioactive minerals that are not clay, such as potassium feldspar or mica in an arkosic sand, which would make a total gamma ray overstate shale volume. And it isolates uranium, which is often associated with organic matter rather than clay.
In many sequences, high-uranium readings mark organic-rich source rocks and condensed sections. Above and below the Cardium, the marine shales are fairly uniform, but a thin uranium-rich bed at the base of the overlying shale makes a useful correlation marker across the field. Using the uranium-free gamma ray, computed from potassium and thorium only, gives a better shale indicator in intervals with organic matter.
Correlation and facies
Gamma ray and SP shapes reflect how the rock was deposited. A curve that becomes steadily cleaner upward, a funnel shape, is typical of a shoreface or delta front sand that coarsened as the shoreline built out. A curve that becomes shalier upward, a bell shape, is typical of a channel fill that fined as the channel was abandoned. A blocky curve with sharp boundaries suggests a sand deposited quickly. These log motifs help geologists interpret depositional settings between wells and predict where the best reservoir will be, which in turn guides where to place horizontal wells.
Worked problem
Shale volume from the gamma ray
In a sandstone interval the clean gamma ray reads 30 API and a nearby thick shale reads 120 API. A shaly sand reads 66 API. Find the gamma ray index and the shale volume by the linear and Larionov older-rock methods.
Show solution
- Index = (66 − 30)/(120 − 30) = 36/90 = 0.40.
- Linear shale volume = 0.40.
- Larionov older rocks = 0.33 × (2^0.80 − 1) = 0.33 × (1.741 − 1) = 0.33 × 0.741 = 0.245.
Answer: The linear method gives 40 percent shale and the Larionov method about 24 percent; core data should decide which fits this rock.
When the SP misleads
Several conditions distort the SP. Thin beds do not develop the full static SP, because the current path is short-circuited through the mud and adjacent shales; the deflection can be a small fraction of the static value in beds less than a few metres or about ten feet thick. Hydrocarbons in a permeable bed reduce the SP deflection, because the bed's resistivity rises and the current through it falls. Shaliness reduces the deflection roughly in proportion to the shale content, which is the basis of an SP-based shale indicator. Very resistive rock, such as tight carbonates, spreads the current over long distances and smears the SP into gentle slopes with poorly defined boundaries. Baseline shifts occur where the shale salinity or the mud changes with depth, and they must be removed before reading deflections. Finally, electrical noise from the rig, nearby cathodic protection systems or magnetized cable can add spikes or slow drifts. For these reasons the SP is used for Rw only in thick, clean, water-bearing beds, and its shale indications are always checked against the gamma ray.
Gamma ray in cased holes and in horizontal wells
The gamma ray is also the main correlation tool in wells that are already cased. A cased-hole gamma ray, run with perforating guns or production logging tools, is matched to the open-hole gamma ray to place perforations and plugs at the right depths. In horizontal wells, the LWD gamma ray is often the main geosteering curve: as the bit moves up or down through a reservoir with shalier rock above and below, the gamma ray rises, warning the directional driller to steer back into the target. Azimuthal gamma ray tools, which measure the radiation from the top and bottom of the hole separately, show whether the well is approaching the upper or lower boundary of a layer.
Common mistakes
MistakeUsing the total gamma ray as a shale indicator in rocks with radioactive feldspar, mica or organic matter.
InsteadCheck with a spectral gamma ray and use the potassium-thorium or thorium curve.
MistakePicking the shale baseline in a highly radioactive organic shale.
InsteadUse a representative clay-rich shale near the reservoir.
MistakeReading Rw from a small SP deflection in a thin or shaly bed.
InsteadUse the static SP from a thick, clean, water-bearing bed only.
MistakeForgetting to correct Rmf to formation temperature before using the SP equation.
InsteadCorrect Rmf first; the equation uses values at formation temperature.
MistakeTreating the linear gamma ray index as the shale volume in every rock.
InsteadCalibrate against core clay content and use a nonlinear relation where it fits better.
Summary and key terms
- The SP records natural electrochemical voltages and works only in conductive water-based mud.
- The static SP in a thick clean water sand gives Rw through the ratio Rmfe/Rwe.
- The gamma ray measures natural radioactivity from potassium, thorium and uranium and is the standard shale indicator.
- Shale volume comes from the gamma ray index, with linear or nonlinear relations calibrated to core.
- Spectral gamma ray separates potassium, thorium and uranium, identifying clays, radioactive non-clay minerals and organic matter.
- Gamma ray and SP shapes reflect depositional environments and are the main tools for correlation.
- Spontaneous potential
- A natural voltage recorded in the borehole that reflects salinity contrasts across shale and permeable rock.
- Static SP
- The full SP deflection that would be measured in a thick clean water-bearing bed.
- Gamma ray index
- The gamma ray reading scaled between clean and shale baselines.
- Shale volume
- The fraction of the rock volume made up of shale.
- Spectral gamma ray
- A gamma ray log that separates potassium, thorium and uranium contributions.
- API unit
- The standard unit of gamma ray intensity, defined by a calibration pit.
Practice problems
Work each problem on paper first, then reveal the answer to check.
Which way does the SP deflect when formation water is saltier than the filtrate?
Show answer
Negative, to the left on standard scales.
Why does organic shale read very high on the gamma ray?
Show answer
It concentrates uranium.
What is a funnel-shaped gamma ray motif?
Show answer
A curve that cleans upward, typical of a prograding shoreface.
Name two sources of Rw besides the SP.
Show answer
A water sample analysis and a Pickett plot of a water zone.
Lesson quiz · 5 questions
Score 60% or more to complete this lesson.
Create a free account to save your progress, take quizzes and earn a certificate.