
PET-350 · Lesson 10 of 12 · 19 min
Nuclear magnetic resonance and advanced logs
The second logging run on the 100/08-27 delineation well brings two tools Ethan has not seen before: a nuclear magnetic resonance tool and a wireline formation tester. 'The conventional logs tell us how much pore space there is and what fraction holds water,' Imogen says. 'They do not tell us how big the pores are, how much of the water is stuck, or where exactly the oil-water contact is. These two tools answer those questions, and they answer them in ways that do not depend on the matrix density or Archie's exponents.'
This lesson covers nuclear magnetic resonance logging, which measures pore-size distributions and separates bound from free fluid, and formation pressure testing, which measures pressures and gradients to find fluid contacts and connectivity. It also introduces other advanced measurements that support formation evaluation.
How nuclear magnetic resonance logging works
Hydrogen nuclei behave like tiny magnets. The nuclear magnetic resonance (NMR) tool uses a strong permanent magnet to align them, then applies short pulses of radio-frequency energy that tip them out of alignment. As they relax back, they emit a small radio signal that the tool records. The initial size of the signal is proportional to the number of hydrogen nuclei in the fluids in the measured volume, which gives a porosity that does not depend on the rock matrix, because the hydrogen in minerals relaxes too fast to be measured. This is one of NMR's main advantages over the density and neutron tools.
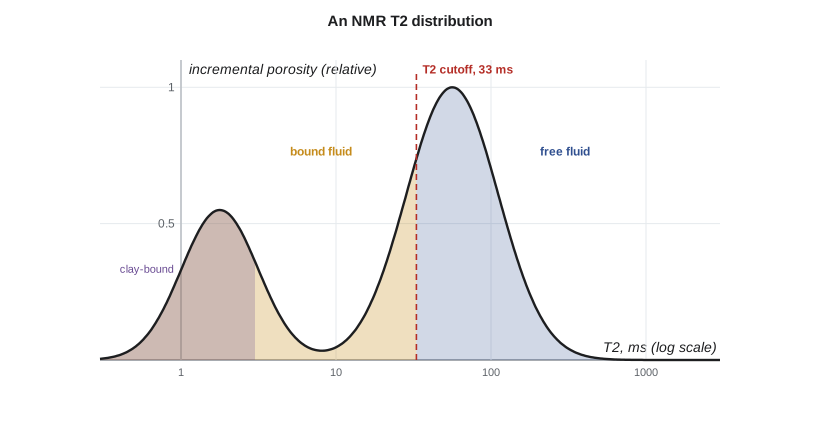
The rate at which the signal decays, characterized by the transverse relaxation time T2, depends on how the fluid interacts with the pore walls. Fluid molecules in small pores bump into the walls often and relax quickly; those in large pores relax slowly. The decay is therefore a mixture of many exponentials, and processing turns it into a T2 distribution: a plot of porosity against relaxation time that is closely related to the distribution of pore sizes in water-wet rock.
Bound and free fluid
A T2 cutoff divides the distribution into fluid that is held in small pores by capillary forces, the bound fluid or bulk volume irreducible (BVI), and fluid in larger pores that can move, the free fluid index (FFI). For sandstones a cutoff of about 33 milliseconds is a common starting value, and for carbonates about 90 to 100 milliseconds, but the right value varies with the rock and should be measured on core by spinning plugs in a centrifuge and comparing NMR distributions before and after. The shortest relaxation times, below about 3 milliseconds, represent water bound to clay, so NMR also estimates clay-bound water and effective porosity.
The free fluid index is a direct estimate of the fluid that can be produced. If the free fluid is all hydrocarbon, the rock will produce water-free; if water saturation from resistivity exceeds the bound-fluid fraction, some water is movable and will come with the oil. Comparing BVI from NMR with bulk volume water from resistivity (lesson 7) is therefore a standard check for water production risk.
Permeability from NMR
Because NMR measures pore size, it can estimate permeability. Two empirical relations are widely used. The Timur-Coates relation uses the ratio of free to bound fluid; the SDR relation, named for the Schlumberger-Doll Research centre where it was developed, uses the logarithmic mean of the T2 distribution.
In the Timur-Coates form, porosity is in percent and C is a constant often near 10 for sandstones, giving permeability in millidarcies. Both relations must be calibrated against core permeability, because surface relaxivity and pore-throat geometry vary between rocks. Once calibrated, they give a continuous permeability profile that core plugs cannot.
# NMR: bound and free fluid from a T2 distribution, Timur-Coates permeability, and fluid contacts from pressures
import math
t2 = [0.5, 1, 2, 4, 8, 16, 32, 64, 128, 256, 512]           # ms
amp = [0.002, 0.005, 0.009, 0.012, 0.010, 0.012, 0.020, 0.025, 0.017, 0.007, 0.002]   # porosity units per bin
cutoff = 33.0                                               # ms, a common sandstone cutoff
phi = sum(amp); bvi = sum(a for t, a in zip(t2, amp) if t < cutoff); ffi = phi - bvi
k = (100 * phi) ** 4 * (ffi / bvi) ** 2 / 10 ** 4 * 1.0     # Timur-Coates with C = 10 (porosity in percent)
print(f"NMR porosity {phi:.3f}, bound fluid {bvi:.3f}, free fluid {ffi:.3f}, Timur-Coates k about {k:.1f} mD")
SI = True
if SI:
    pts = [(1546.0, 15610), (1549.0, 15631), (1552.0, 15652), (1557.0, 15695), (1560.0, 15725), (1563.0, 15755)]
    du, pu = "m", "kPa"
else:
    pts = [(10430.0, 4600.0), (10440.0, 4603.2), (10450.0, 4606.4), (10466.0, 4612.56), (10476.0, 4617.06), (10486.0, 4621.56)]
    du, pu = "ft", "psi"
def fit(p):
    xs, ys = [a for a, _ in p], [b for _, b in p]
    xb, yb = sum(xs) / len(xs), sum(ys) / len(ys)
    s = sum((x - xb) * (y - yb) for x, y in zip(xs, ys)) / sum((x - xb) ** 2 for x in xs)
    return s, yb - s * xb
so, io = fit(pts[:3]); sw, iw = fit(pts[3:])
contact = (iw - io) / (so - sw)
print(f"upper gradient {so:.3f} {pu}/{du} (oil), lower gradient {sw:.3f} {pu}/{du} (water)")
print(f"gradients intersect at {contact:,.1f} {du}: the free water level")NMR porosity 0.121, bound fluid 0.070, free fluid 0.051, Timur-Coates k about 1.1 mD upper gradient 7.000 kPa/m (oil), lower gradient 10.000 kPa/m (water) gradients intersect at 1,554.3 m: the free water level
For the main Cardium sand in the 100/08-27 delineation well, the program finds an NMR porosity of 12.1 percent, of which 7.0 percent is bound and 5.1 percent free, and a Timur-Coates permeability of about 1 mD. That matches the low-millidarcy core permeabilities the team expected and confirms that the bound water is a large share of the pore space, consistent with the bulk volume water seen in lesson 7.
NMR has other uses. Hydrocarbons relax at characteristic rates that depend on viscosity, so light oil, heavy oil and gas can sometimes be distinguished. Diffusion measurements separate gas from water, because gas molecules diffuse faster. And because the tool reads a few centimetres into the rock, it sees the flushed zone, which must be remembered when interpreting fluid content.
Formation pressure testing
A wireline formation tester is set against the borehole wall at a chosen depth. A packer seals around a probe, the tool draws a small volume of fluid from the formation, and a pressure gauge records the pressure as it builds back to the formation pressure. Each test takes a few minutes. Many tests at different depths give a pressure profile of the well. Modern testers also pump fluid through optical analysers that measure its composition and contamination, and they collect fluid samples in pressurized bottles for laboratory analysis.
The pressure profile answers several questions. Within one continuous fluid column, pressure rises linearly with depth at a gradient set by the fluid density. Gas gradients are small, oil gradients moderate and water gradients largest. Where two lines with different gradients meet, there is a fluid contact.
Typical gradients are about 1 to 3 kPa/m for gas, 6.5 to 8.5 kPa/m for light to medium oil and 9.8 to 11.3 kPa/m for water, depending on salinity.
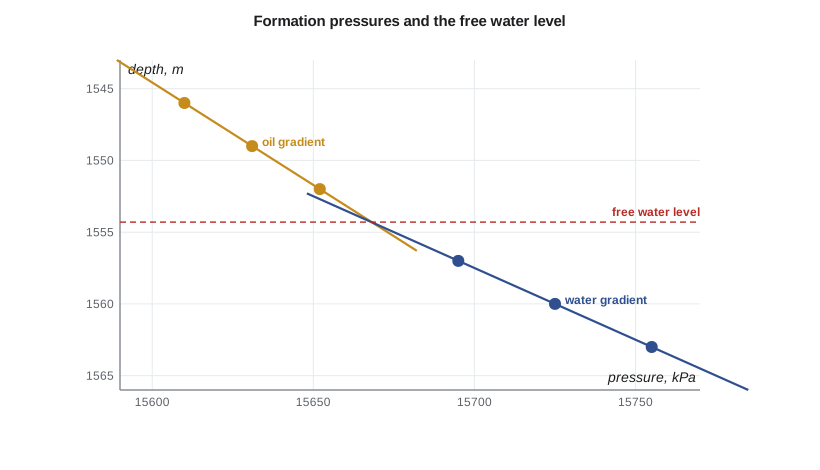
The pressure points in the 100/08-27 delineation well form two lines. The upper three, in the oil zone, fit a gradient of 7.0 kPa/m, which matches a light oil, and the lower three, in the water zone, fit 10.0 kPa/m. The lines intersect at about 1554.3 m, the free water level: the depth at which the capillary pressure between oil and water is zero.
The free water level is not the same as the oil-water contact seen on logs. Above the free water level, capillary forces hold water in the pores, so the water saturation decreases gradually upward through a transition zone. The log contact, where saturation first drops below 100 percent or where the rock begins to produce oil, lies above the free water level by a height that depends on pore size: a few metres or feet in good rock, much more in tight rock. Lesson 11 shows how capillary pressure from core gives that height.
Pressures and connectivity
Pressure profiles also reveal whether layers are connected. In a field that has been produced, layers in good communication with producing wells are depleted, while layers that are isolated retain higher pressure. A sudden offset in pressure between two sands that should share a gradient shows a barrier. Comparing pressures in a new well with the original field pressure shows where depletion has reached. For Lena, the 100/08-27 delineation well pressures are as important as the saturations: they show how far the existing horizontals have drained the rock around the new location.
Testers also measure mobility, the ratio of permeability to viscosity, from the drawdown pressure and the rate of buildup during each test. These estimates sample a small volume near the probe but give useful relative permeability information along the well. More extended tests, called mini drill-stem tests or interval pressure transient tests, isolate a short interval between two packers and flow it for longer, sampling a larger volume and giving permeability and skin, a step toward the full well tests of PET-360.
Other advanced measurements
Pulsed neutron tools, run in cased wells, use an electronic neutron generator to measure capture cross section and carbon-oxygen ratios, giving saturation behind casing for monitoring producing fields. Geochemical spectroscopy tools measure gamma rays from neutron-induced reactions with silicon, calcium, iron, sulphur and other elements, and convert the elemental yields into mineral volumes, which is especially useful in complex and unconventional rocks. Dielectric tools measure how the rock responds to high-frequency electromagnetic fields; because water has a very high dielectric constant, they give water-filled porosity in the flushed zone independent of water salinity, useful where Rw is unknown or fresh.
These tools are not run on every well. A petrophysicist chooses them, as in lesson 1, for the decisions they inform, and weighs their cost and the extra rig time against the value of the information.
Worked problem
Finding a contact from pressures
A formation tester records 14,200 kPa at 1440 m and 14,221 kPa at 1443 m in an oil zone, and 14,279 kPa at 1450 m and 14,329 kPa at 1455 m in the water zone below. Find the two gradients and the free water level.
Show solution
- Oil gradient = (14,221 − 14,200)/3 = 7.0 kPa/m; water gradient = (14,329 − 14,279)/5 = 10.0 kPa/m.
- Oil line: p = 14,200 + 7.0(D − 1440). Water line: p = 14,279 + 10.0(D − 1450).
- Setting them equal: 14,200 + 7D − 10,080 = 14,279 + 10D − 14,500, so 4,120 + 7D = −221 + 10D, giving 3D = 4,341 and D = 1447.0 m.
Answer: The free water level lies at about 1447 m, between the oil and water tests.
Planning formation tests
Formation tests take rig time, and each probe setting carries a small risk of the tool sticking against the wall. A test plan chooses depths that will define the gradients and contacts with the fewest settings. Points are placed in clean, permeable intervals identified from the logs, because tight or shaly points give slow buildups that may not reach formation pressure, called supercharged or tight tests. At least three good points are needed in each fluid column to define a gradient with confidence, and points should span as much of each column as possible. Pressures must be corrected for gauge temperature effects and checked against the mud hydrostatic pressure recorded before and after each test, which also confirms that the gauge is working. Where fluid samples are planned, the tool pumps until the optical analyser shows that filtrate contamination has fallen to an acceptable level before the sample bottle is filled.
Common mistakes
MistakeUsing a single NMR T2 cutoff for every rock.
InsteadCalibrate the cutoff with centrifuged core.
MistakeEquating the free water level with the log oil-water contact.
InsteadThe log contact lies above the free water level by the capillary transition height.
MistakeFitting one gradient through points from layers that are not connected.
InsteadCheck for pressure offsets that show barriers or depletion.
MistakeTreating tester mobility as reservoir permeability.
InsteadIt samples a tiny volume near the probe; use it for relative comparisons.
MistakeForgetting that NMR reads the flushed zone.
InsteadInterpret NMR fluid content with invasion in mind.
Summary and key terms
- NMR measures hydrogen in pore fluids, giving a lithology-independent porosity and a T2 distribution related to pore size.
- A T2 cutoff splits porosity into bound and free fluid; clay-bound water appears at the shortest times.
- Timur-Coates and SDR relations estimate permeability from NMR after calibration to core.
- Formation testers measure pressure profiles; gradients identify fluids and their intersections give free water levels.
- The log contact lies above the free water level because of capillary transition zones.
- Pulsed neutron, spectroscopy and dielectric tools add saturation, mineralogy and water-volume information where needed.
- T2 distribution
- The distribution of NMR relaxation times, related to pore sizes.
- Bulk volume irreducible
- The fraction of rock volume holding fluid that will not flow.
- Free fluid index
- The fraction of rock volume holding movable fluid.
- Formation tester
- A tool that measures formation pressure and collects fluid samples at chosen depths.
- Pressure gradient
- The rate of change of pressure with depth in a fluid column.
- Free water level
- The depth where oil-water capillary pressure is zero.
Practice problems
Work each problem on paper first, then reveal the answer to check.
Why is NMR porosity independent of lithology?
Show answer
Hydrogen in minerals relaxes too fast to be measured; only fluid hydrogen is counted.
What does a long T2 time indicate?
Show answer
Fluid in large pores.
What does an offset in pressure between two sands suggest?
Show answer
A barrier between them, or different depletion.
Which has the larger pressure gradient, oil or water?
Show answer
Water.
Lesson quiz · 5 questions
Score 60% or more to complete this lesson.
Create a free account to save your progress, take quizzes and earn a certificate.