
PET-350 · Lesson 11 of 12 · 19 min
Core analysis and core-log integration
Two weeks after the 100/08-27 delineation well was logged, the first core analysis results arrive from a commercial core laboratory in Calgary. Fifty-four metres of core were cut through the Cardium, slabbed, photographed and sampled with plugs every 30 cm. Imogen spreads the data across her desk next to the logs. 'Logs give us continuous measurements, but every one of them is an inference,' she says. 'Core is the rock itself. When the two disagree, the core is usually right about the rock at that point, and the logs are usually right about how the rock varies between the points. Our job is to make them agree.'
This lesson describes how core is cut, handled and analysed; the routine measurements of porosity, permeability, grain density and saturation; the special core analysis measurements of capillary pressure, relative permeability, electrical properties and rock mechanics; and the methods used to integrate core with logs, including depth matching, porosity calibration and the use of capillary pressure to predict saturation with height.
Cutting and handling core
Conventional core is cut with a hollow core bit that leaves a cylinder of rock in an inner barrel, typically 9 to 18 m or 30 to 60 ft per run. The barrel is brought to surface, and the core is removed, marked for depth and orientation, and preserved. Preservation matters because fluids escape and rock properties change as the core is depressurized and exposed to air. Sections may be wrapped and sealed, frozen or kept in sealed tubes for special tests. Gas expanding from solution as the core comes to surface can crack weak rock and flush fluids, so the saturations in core recovered at surface are not the original reservoir saturations.
At the laboratory, a core gamma scan is run along the full core length so that it can be depth-matched to the downhole gamma ray. The core is then slabbed lengthwise, photographed in white and ultraviolet light (oil fluoresces), and described by a geologist for lithology, grain size, sedimentary structures and fractures. Plugs, small cylinders about 25 to 40 mm across, are drilled at regular spacing and at chosen points for testing. Sidewall cores, taken by wireline tools from the borehole wall after logging, give small samples at chosen depths without the cost of conventional coring, though they are often damaged by the coring process.
Routine core analysis
Routine core analysis measures the basic properties on every plug. Porosity is usually measured by helium expansion: the grain volume is found from Boyle's law in a calibrated chamber, and the bulk volume from calipers or mercury displacement, giving porosity and grain density. Helium porosity includes clay-bound water space once the plug has been dried, so it is closer to total porosity; humidity-controlled drying preserves the bound water and gives a value closer to effective porosity. Grain density from the same measurement is the most reliable source of the matrix density for the density log, as lesson 5 used.
Permeability is measured by flowing gas, usually air or nitrogen, through the plug at a known pressure drop. At low pressures, gas molecules slip along pore walls, so gas permeability is higher than the permeability to liquid. Klinkenberg showed that the gas permeability varies linearly with the inverse of the mean pressure, and extrapolating to infinite pressure gives the Klinkenberg-corrected liquid-equivalent permeability. The effect is largest in tight rocks. Permeability is also strongly affected by the confining stress, so measurements at net overburden stress are preferred for reservoir use, especially in tight rocks where the difference can be a factor of two or more.
Fluid saturations are measured by the Dean-Stark method, in which a solvent distils water out of the plug and the water volume is measured, or by retort heating. Saturations in core from water-based mud are altered by filtrate invasion and by gas expansion during recovery, so they are used with care. Core cut with oil-based mud and low invasion can preserve the original water saturation, giving a valuable direct calibration of log saturations.
# Core-log calibration: depth shift, porosity regression, Klinkenberg correction and height above free water
import math
SI = True
core = [0.112, 0.135, 0.128, 0.098, 0.121, 0.140, 0.117]
log_ = [0.120, 0.141, 0.136, 0.104, 0.130, 0.147, 0.124]     # density porosity at the same (shifted) depths
xb, yb = sum(log_) / len(log_), sum(core) / len(core)
s = sum((x - xb) * (y - yb) for x, y in zip(log_, core)) / sum((x - xb) ** 2 for x in log_)
c = yb - s * xb
bias = sum(x - y for x, y in zip(log_, core)) / len(core)
print(f"core porosity = {s:.3f} x log porosity {c:+.4f}; mean log - core bias {bias * 100:.2f} porosity units")
# Klinkenberg: k_air = k_liquid (1 + b/p_mean); two mean pressures give k_liquid
p1, k1, p2, k2 = 1.5, 3.10, 6.0, 2.36                       # atm, mD
kl = (k1 * p1 - k2 * p2) / (p1 - p2)
print(f"air permeabilities {k1} and {k2} mD -> Klinkenberg liquid permeability {kl:.2f} mD")
# capillary pressure to height: h = Pc_res / ((rho_w - rho_o) g)
pc_lab = 35.0                                              # kPa air-brine, at the Sw of interest
pc_res = pc_lab * (26.0 * math.cos(math.radians(30))) / (72.0 * math.cos(0))   # oil-brine conversion
drho = 1050.0 - 780.0                                       # kg/m3
h = pc_res * 1000 / (drho * 9.81)
print(f"lab Pc {pc_lab} kPa -> reservoir Pc {pc_res:.1f} kPa -> height above free water {h:.1f} m" if SI else
f"lab Pc {pc_lab * 0.145:.2f} psi -> reservoir Pc {pc_res * 0.145:.2f} psi -> height above free water {h * 3.281:.0f} ft")core porosity = 0.989 x log porosity -0.0059; mean log - core bias 0.73 porosity units air permeabilities 3.1 and 2.36 mD -> Klinkenberg liquid permeability 2.11 mD lab Pc 35.0 kPa -> reservoir Pc 10.9 kPa -> height above free water 4.1 m
The program shows three standard tasks. After depth shifting, density porosity reads on average 0.73 porosity units higher than core porosity, and a regression gives a nearly one-to-one line offset by about 0.6 porosity units. The offset suggests the log matrix or fluid density needs a small adjustment, which Imogen makes. Two gas permeability measurements at mean pressures of 1.5 and 6 atmospheres give a Klinkenberg permeability of about 2.1 mD, a third lower than the lower-pressure air value.
Special core analysis
Special core analysis, or SCAL, covers measurements made on selected plugs to characterize how fluids behave in the rock. They are expensive and slow, and they are chosen to represent the main rock types.
Capillary pressure measurements describe how saturation varies with the pressure difference between a non-wetting fluid such as oil and the wetting water. A plug is saturated with brine and then displaced by oil or air at increasing pressures in a porous-plate cell, a centrifuge or a mercury injection apparatus. The result is a curve of capillary pressure against saturation. In the reservoir, capillary pressure at any height above the free water level equals the density difference between water and oil times gravity times that height, so the laboratory curve converts to a saturation-height curve.
The program converts a laboratory air-brine capillary pressure of 35 kPa to about 10.9 kPa under reservoir oil-brine conditions, using typical interfacial tension and contact angle values. With a density difference of 270 kg/m³, that saturation is reached about 4.1 m above the free water level. Combined with the free water level of 1554.3 m from lesson 10, the capillary pressure curves give the expected saturation at every depth, which can be compared directly with the log saturations.
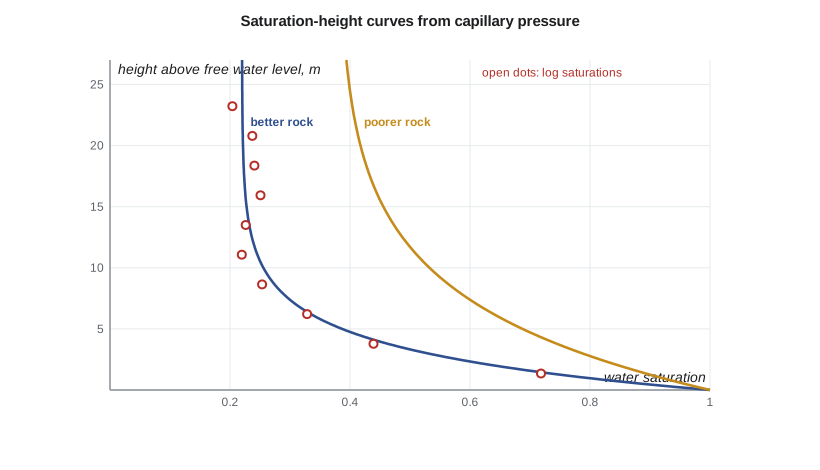
Capillary pressure curves vary with rock quality, so they are grouped by rock type, often using the Leverett J-function, which normalizes capillary pressure by the square root of permeability over porosity. A single J-function curve can then represent a range of permeabilities. Where log saturations and saturation-height predictions agree, both are confirmed; where they disagree, the resistivity interpretation or the capillary model needs revisiting.
Relative permeability measurements show how easily oil and water flow when both are present, as functions of saturation. They are made by steady-state flow of both fluids at fixed ratios, or by unsteady-state displacement of one fluid by the other. The endpoints, irreducible water saturation and residual oil saturation, and the shapes of the curves feed the fractional flow calculations of PET-320 and reservoir simulation.
Electrical properties measured on core give the Archie cementation exponent m, from the formation factor of brine-saturated plugs at several porosities, and the saturation exponent n, from resistivity index measurements as the plugs are desaturated. Cation exchange capacity for the Waxman-Smits model of lesson 8 is measured chemically. These measurements replace the assumed m = n = 2 with values for the reservoir.
Rock mechanics tests measure strength and elastic properties under triaxial stress, calibrating the dynamic properties from the dipole sonic for completion design.
Depth matching core to logs
Core depths come from the driller's measurements of the core barrel and are rarely identical to log depths. The core gamma scan is compared with the downhole gamma ray, as in lesson 1, and the core is shifted to match, often by a different amount for each core run. For the 100/08-27 delineation well, the cores need shifts of 0.8 to 1.6 m. Without the shift, every core-log comparison would compare different rock.
Calibrating logs with core
Once depth-matched, core is used to calibrate almost every log interpretation step. Grain densities set the matrix density. Core porosity checks density, neutron and NMR porosity. Core permeability calibrates NMR permeability and a porosity-permeability transform for the logs. X-ray diffraction mineralogy checks shale volume and multi-mineral models. Measured m and n replace assumed exponents. Capillary pressure saturations check log saturations. Each calibration removes a source of systematic error, and together they make the log interpretation defensible.
There are scale issues. A plug measures a small volume of rock, while logs average over tens of centimetres or a foot or more. In thinly bedded or heterogeneous rock, plug values scatter much more than log values. Comparisons are therefore made on averages over intervals or after smoothing the core data to log resolution. Plugs also tend to be taken from the best, most competent rock, which can bias averages upward.
The core is also a public resource. After the confidentiality period, the 08-27 core will be stored at the AER Core Research Centre in Calgary, where other operators and researchers can examine it, as Imogen's team examined cores from older wells while planning.
Worked problem
Height above free water
A laboratory air-brine capillary pressure of 70 kPa gives a water saturation of 30 percent. The air-brine σcosθ is 72 mN/m and the reservoir oil-brine σcosθ is 22 mN/m. The water and oil densities are 1050 and 800 kg/m³. At what height above the free water level is the saturation 30 percent?
Show solution
- Reservoir Pc = 70 × 22/72 = 21.4 kPa.
- Density difference = 1050 − 800 = 250 kg/m³.
- Height = 21,400/(250 × 9.81) = 8.7 m.
Answer: The saturation reaches 30 percent about 9 m above the free water level.
Rock typing
Core data are most useful when they are grouped into rock types: groups of rock with similar pore geometry and therefore similar porosity-permeability trends, capillary pressure curves and electrical properties. Rock types can be defined from core descriptions, from mercury injection pore-throat sizes, from the flow zone indicator method, which groups samples by the ratio of permeability to porosity, or from the Lucia classes in carbonates. Once rock types are defined on core, a log-based classifier, often a set of rules or a statistical model using gamma ray, porosity, NMR and resistivity, predicts them in uncored wells. Each rock type then carries its own permeability transform, saturation-height function and Archie exponents into the field model. This is how a few hundred plugs from one or two cored wells end up describing a whole field.
Common mistakes
MistakeComparing core and log data without depth matching.
InsteadShift the core to the logs using the core gamma scan.
MistakeUsing uncorrected air permeability in tight rocks.
InsteadApply the Klinkenberg correction and measure at reservoir stress.
MistakeTaking core saturations from water-based mud cores as original reservoir values.
InsteadInvasion and gas expansion alter them; use oil-based mud cores for saturation calibration.
MistakeUsing laboratory capillary pressure directly as reservoir capillary pressure.
InsteadConvert with the interfacial tension and contact angle ratio.
MistakeComparing single plug values with log readings in heterogeneous rock.
InsteadCompare interval averages or upscaled core data.
Summary and key terms
- Core is cut, preserved, gamma-scanned, slabbed, photographed, described and plugged.
- Routine analysis measures porosity, grain density, Klinkenberg-corrected permeability and fluid saturations.
- Special core analysis measures capillary pressure, relative permeability, electrical properties and rock mechanics.
- Capillary pressure converts to saturation-height curves using fluid densities and the free water level.
- Core is depth-matched with a core gamma scan and then used to calibrate every step of log interpretation.
- Scale differences between plugs and logs mean comparisons should use averaged data.
- Routine core analysis
- Standard measurements of porosity, permeability, grain density and saturation on plugs.
- Special core analysis (SCAL)
- Measurements of capillary pressure, relative permeability, electrical and mechanical properties.
- Klinkenberg correction
- The adjustment of gas permeability to a liquid-equivalent value.
- Capillary pressure
- The pressure difference between non-wetting and wetting fluids in a pore system.
- Leverett J-function
- A dimensionless capillary pressure that normalizes for porosity and permeability.
- Core gamma scan
- A gamma ray log measured along the core at surface for depth matching.
Practice problems
Work each problem on paper first, then reveal the answer to check.
Why is gas permeability higher than liquid permeability at low pressure?
Show answer
Gas molecules slip along the pore walls.
What two fluid properties convert lab capillary pressure to reservoir conditions?
Show answer
Interfacial tension and contact angle.
Why are core saturations from water-based mud cores unreliable?
Show answer
Filtrate invasion and gas expansion change them.
What log curve is compared with the core gamma scan?
Show answer
The downhole gamma ray.
Lesson quiz · 5 questions
Score 60% or more to complete this lesson.
Create a free account to save your progress, take quizzes and earn a certificate.