
PET-350 · Lesson 1 of 12 · 24 min
Formation evaluation and the logging operation
Ethan Cardinal's next rotation at Prairie Crest Energy Ltd. takes him out of production and into the geoscience group, where the petrophysicist Imogen Tait is planning the evaluation of a new well. The 100/08-27 delineation well will be drilled as a vertical well about two kilometres from the 03-22 pad, cored through the Cardium, and logged with a full wireline suite before the company decides whether to drill more horizontal wells in that part of the Tamarack Lake field. 'Everything we know about a reservoir starts with measurements like these,' Imogen tells him at the planning meeting. 'Lena's material balance, Tom's completion design and your production forecasts all rest on porosity, saturation and thickness numbers that come out of logs and core. In the next twelve weeks you are going to learn where those numbers come from, and how wrong they can be.'
This course covers formation evaluation: the measurements and interpretation methods used to find hydrocarbons in the rock around a well and to say how much there is. This first lesson describes what formation evaluation tries to answer, the main ways data are acquired, how a logging job is planned and run, what a log print contains, how depths are controlled, and how logging tools that contain radioactive sources are regulated. Later lessons take each measurement in turn and then combine them into a full evaluation of the 100/08-27 delineation well.
The questions formation evaluation answers
A petrophysicist is asked a small number of practical questions about every interval of rock a well penetrates. Is it reservoir rock, meaning rock with enough connected pore space to store and deliver fluids, or is it shale or tight rock that will act as a seal or as waste? If it is reservoir rock, how much pore space does it have, measured as porosity? What fraction of that pore space holds water, and so what fraction holds oil or gas? Will the hydrocarbon flow, which depends on permeability, and will it flow alone or with water? Where are the contacts between gas, oil and water? And how thick is the interval that meets all of these tests, which is called the net pay?
No single tool measures these quantities directly. A logging tool measures a physical property such as natural radioactivity, electrical resistivity, electron density, hydrogen content or the travel time of sound. Interpretation turns those physical measurements into porosity, saturation and lithology using models that relate the rock's physics to its pore system. Each model has parameters that must be chosen, and each tool has a limited depth of investigation and vertical resolution. Much of the skill in formation evaluation lies in knowing which measurement to trust in which situation, and in calibrating log interpretations against the rock itself through core analysis.
Sources of formation evaluation data
Mud logging comes first. While the well is drilled, a mud-logging geologist examines the rock cuttings carried to surface by the drilling mud, describes their lithology, and monitors the gas released from the mud with a gas chromatograph. Mud logs give the first indication of hydrocarbons and help pick formation tops and coring points. Drilling data such as the rate of penetration and the weight on bit also show changes in rock type.
Logging while drilling, or LWD, places sensors in the drill collars just behind the bit. Gamma ray, resistivity, density, neutron and sonic measurements can all be made while drilling, and the data are sent to surface in real time by mud-pulse telemetry or stored in tool memory and downloaded when the drill string comes out. LWD is essential in horizontal wells, where wireline tools cannot easily reach, and it measures the rock before the drilling fluid has invaded far. The horizontal wells at the Tamarack Lake field were steered with LWD gamma ray and resistivity, as described in PET-310.
Wireline logging lowers a string of tools on an armoured electrical cable after a section of hole has been drilled. The cable carries power down and data up, and it measures depth as it is spooled off a drum at the logging unit. Wireline tools are generally more accurate and offer a wider range of measurements than LWD tools, and they are the standard for vertical evaluation wells such as the 100/08-27 delineation well.
Formation testers and samplers, also run on wireline or in the drill string, measure formation pressure at chosen points, collect fluid samples and estimate permeability. Cores are cylinders of rock cut with a special core bit and brought to surface for laboratory analysis; sidewall cores are small plugs taken from the borehole wall by a wireline tool. Well tests, covered in PET-360, measure the flow capacity of the formation over a much larger volume than any log or core.
Each data source samples a different volume of rock. A core plug might be 25 to 40 mm across; a log measures a volume perhaps tens of centimetres across and tens of centimetres tall; a well test responds to tens or hundreds of metres of formation around the well. Reconciling measurements made at such different scales is a theme throughout the course.
Planning a logging program
Imogen's first job is to write the logging program for the 100/08-27 delineation well. A logging program states what decisions the data must support and then chooses the measurements that will support them. For this well the decisions are whether the Cardium here has enough porosity and hydrocarbon saturation to justify more horizontal wells, where the oil-water contact lies, and what rock properties the completion engineers should design around.
| Measurement | Main purpose for the delineation well |
|---|---|
| Gamma ray and spontaneous potential | Correlation with nearby wells, shale volume, formation water resistivity |
| Array resistivity (induction or laterolog) | Water saturation; invasion and permeability indication |
| Density with photoelectric factor | Porosity and lithology |
| Neutron porosity | Porosity, gas detection and shale indication with the density |
| Sonic (compressional and shear) | Porosity check, rock mechanics for fracture design, seismic tie |
| Nuclear magnetic resonance | Pore size, bound and free fluid, permeability estimate |
| Formation pressure tester | Pressure gradients, fluid contacts, depletion from nearby production |
| Borehole image | Fractures, bedding and stress direction |
| Caliper | Hole size and shape for log corrections and cement volume |
Logging programs balance information against cost and risk. Every hour the rig waits on logging costs money, and every tool run into an open hole carries a small risk of becoming stuck. Imogen keeps the essential measurements in one combined run, called a triple combo in industry shorthand (gamma ray, resistivity, and density-neutron), and adds the more specialized tools in a second run only over the reservoir interval. She also specifies the hole and mud conditions the tools need, because some tools work only in conductive water-based mud and others only in nonconductive oil-based mud.
The program also sets logging speeds. Most tools sample the formation at fixed time intervals, so pulling the tool faster means fewer samples per metre or foot and, for nuclear tools that count gamma rays or neutrons, more statistical noise. Typical speeds are a few hundred metres or about a thousand to two thousand feet per hour for combined tools, and slower for nuclear magnetic resonance and imaging tools.
The logging job
When the 100/08-27 delineation well reaches total depth, the Northgate Wireline crew arrives with their logging unit, a truck carrying the cable drum, winch, surface computers and power supplies. Victor Haines, the field engineer, meets Ethan on the lease. The crew rigs a sheave wheel in the derrick, makes up the tool string on the catwalk, and runs a short check of each sensor against its calibration before lowering it into the well. 'We log up,' Victor explains. 'Pulling the cable keeps it tight, so the depth measurement is more reliable than when the tool is running down under its own weight.'
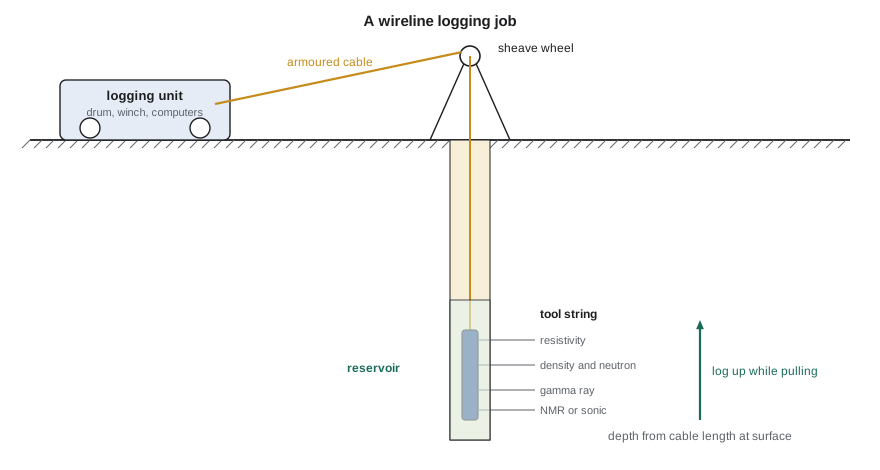
The tool string goes to bottom, the crew records a short repeat section over the reservoir as a check of tool stability, and then the main pass is logged upward to the casing shoe. Tension, cable speed and the readings of every sensor are monitored in real time. A good engineer watches for signs of trouble: a tool sticking against the borehole wall shows as a flat line and a jump in cable tension, and a sudden change in caliper may mean washed-out hole that will affect the pad-contact tools.
Before leaving, the crew delivers field prints and digital data. The digital deliverable is usually a file in the LAS (Log ASCII Standard) or DLIS format, which records each curve, its units and the header information. The final processed data and prints follow after quality checks.
Reading a log print
A log print is laid out with depth running down the page and several tracks side by side. Track 1, on the left, usually carries the gamma ray, the spontaneous potential and the caliper on linear scales. The depth track lies next to it. Track 2 commonly shows resistivity curves on a logarithmic scale, because resistivity varies over several orders of magnitude. Track 3 carries the porosity curves: density, neutron and sonic, often on scales chosen so that the curves overlie each other in clean water-bearing rock of the expected lithology.
The header at the top of the print records the information needed to interpret it: the company, well name and location; the depths logged; the bit size and casing depth; the mud type, weight and viscosity; the resistivities of the mud, mud filtrate and mud cake and the temperatures at which they were measured; the maximum recorded temperature; the tool combination and its calibration dates; and remarks about any problems. Lesson 2 shows why the mud resistivities and the temperatures matter. A petrophysicist who skips the header will eventually make a large error.
Prints also carry scale information for each curve, a repeat section, and a set of calibration summaries. Reading the scales carefully is basic but important, because curves can wrap around when they exceed the track width, and different service companies use different conventions for colours and line styles.
Depth control
Every log value is attached to a depth, and errors in depth propagate into every later result. Wireline depth comes from a calibrated measuring wheel on the cable, corrected for cable stretch under its own weight and the tool's weight. LWD depth comes from the length of drill pipe in the hole, measured at surface by the rig's depth tracking system. The two methods are independent, and they rarely agree exactly; differences of a metre or a few feet are common at reservoir depth.
Depth control matters most when data from different runs or different sources are combined. Cores must be shifted to match the logs before core and log porosities are compared. A formation test point must be set at the depth of the intended rock layer, not a metre above it in shale. Logs from a second run must be matched to the first. The usual reference is the gamma ray, which is run on almost every logging string, so curves are shifted until their gamma ray traces line up.
# Depth-match a logging-while-drilling gamma ray to the wireline gamma ray by trying shifts
import math
SI = True
step = 0.25 if SI else 1.0            # sample interval: 0.25 m or 1 ft
unit = "m" if SI else "ft"
top = 1540.0 if SI else 10400.0
n = 160
def gr(depth_index):                   # a made-up but log-like gamma ray: sands near 40, shales near 120 API
    x = depth_index * 0.18
    return 80 + 38 * math.sin(x) + 18 * math.sin(2.7 * x + 0.6) + 6 * math.sin(7.1 * x)
wireline = [gr(i) for i in range(n)]
true_shift = 6                         # the LWD log reads 6 samples deep
lwd = [gr(i - true_shift) + 3 * math.sin(11 * i) for i in range(n)]
def corr(a, b):
    ma, mb = sum(a) / len(a), sum(b) / len(b)
    num = sum((x - ma) * (y - mb) for x, y in zip(a, b))
    den = math.sqrt(sum((x - ma) ** 2 for x in a) * sum((y - mb) ** 2 for y in b))
    return num / den
best = None
print("shift   correlation")
for s in range(-10, 11):
    pairs = [(wireline[i], lwd[i + s]) for i in range(20, n - 20)]
    r = corr([p[0] for p in pairs], [p[1] for p in pairs])
    if s % 2 == 0: print(f"{s * step:+6.2f} {unit}  {r:6.3f}")
    if best is None or r > best[1]: best = (s, r)
print(f"best shift: LWD log reads {best[0] * step:.2f} {unit} deep (correlation {best[1]:.3f})")
print(f"so an LWD reading at {top + 80 * step:.2f} {unit} belongs at {top + (80 - best[0]) * step:.2f} {unit} on the wireline depth")shift correlation -2.50 m -0.760 -2.00 m -0.485 -1.50 m -0.300 -1.00 m -0.136 -0.50 m -0.040 +0.00 m 0.209 +0.50 m 0.550 +1.00 m 0.838 +1.50 m 0.998 +2.00 m 0.836 +2.50 m 0.549 best shift: LWD log reads 1.50 m deep (correlation 0.998) so an LWD reading at 1560.00 m belongs at 1558.50 m on the wireline depth
The program tries a range of shifts and computes the correlation between the two gamma ray traces for each. The correlation peaks sharply at a shift of 1.50 m, where it reaches 0.998, so every LWD curve recorded on the 100/08-27 delineation well is moved 1.50 m shallower before it is compared with wireline data. A correlation of nearly 1 is typical when two clean gamma ray traces are matched over a good interval of alternating sand and shale; flatter intervals give broader peaks and less certain shifts.
Radioactive sources and regulation
Two of the most important porosity tools, the density and neutron tools, contain sealed radioactive sources. The density tool uses a gamma-ray source and the neutron tool a neutron source. These sources are sealed capsules designed to stay intact under the temperatures and pressures of a well, and they are handled only by trained and licensed staff using special tools and shielded containers. Pulsed neutron tools use an electronic generator that produces neutrons only when switched on, an option that is becoming more common.
In Canada, possessing and using these sources requires a licence from the Canadian Nuclear Safety Commission, which sets requirements for training, dosimetry, storage, transport, leak testing and emergency plans. The provincial oil and gas regulator also has rules for what must happen if a source is lost in a well. A source that cannot be recovered after reasonable attempts is normally abandoned in place behind a cement plug, with the well marked and records filed so that later operations do not disturb it. Service companies hold the licences, but the operator must cooperate with the plans and must stop and report if a source is lost.
For a petrophysicist, the practical consequences are simple. Nuclear tools are rigged up and run only by the licensed crew. The well site restricts access around the source handling area during rig-up and rig-down. If a nuclear tool becomes stuck, the response follows the service company's approved procedures, and the decision to fish or abandon is made with the regulator's requirements in mind.
Data submission
Logs are not only company property; they are also part of the public record. In Alberta, the Alberta Energy Regulator requires operators to submit well logs and other well data within set time limits after a well is finished, and the data become public after a confidentiality period. Core and drill cuttings must also be submitted to the AER Core Research Centre in Calgary, where they are stored and can be examined by others. This public archive is one reason western Canada has such a deep record of subsurface information. Ethan's team will use logs from dozens of older wells around the 100/08-27 delineation well to map the Cardium before their own well is drilled.
Worked problem
Choosing what to log
A delineation well must answer three questions: is there enough porosity, is the rock oil-bearing, and where is the oil-water contact? The budget allows one combined run plus one specialized tool. Which specialized tool best answers the third question?
Show solution
- Porosity is answered by the density and neutron in the combined run.
- Oil saturation is answered by the resistivity in the combined run, together with porosity.
- The contact can be estimated from resistivity changes, but it is uncertain in low-porosity rock where resistivity contrasts are small.
- A formation pressure tester measures the pressure gradient in the oil and water zones; the intersection of the two gradients gives the free water level directly.
Answer: The formation pressure tester. It answers the contact question with an independent physical measurement, which lesson 10 develops.
Common mistakes
MistakeInterpreting logs without reading the header.
InsteadCheck the mud type, mud resistivities, temperatures, bit size and remarks first; they change the interpretation.
MistakeAssuming LWD and wireline depths agree.
InsteadDepth-match all curves to a common reference, usually the gamma ray, before combining them.
MistakeLogging nuclear tools too fast to save rig time.
InsteadFollow the planned speeds; faster logging adds statistical noise to porosity measurements.
MistakeTreating a log as a direct measurement of porosity or saturation.
InsteadLogs measure physical properties; porosity and saturation come from models with chosen parameters.
MistakeExpecting core, logs and well tests to agree exactly.
InsteadEach samples a different volume of rock; reconcile them with their scales in mind.
Summary and key terms
- Formation evaluation identifies reservoir rock, porosity, saturation, permeability, contacts and net pay.
- Data come from mud logs, LWD, wireline logs, formation testers, cores and well tests, each sampling a different volume.
- A logging program chooses measurements for the decisions they support and balances information against rig time and risk.
- Log prints have tracks for correlation, resistivity and porosity curves, and a header that records the conditions needed for interpretation.
- Depth matching, usually on the gamma ray, must come before data from different runs or sources are combined.
- Tools with radioactive sources are licensed and handled under nuclear safety rules, with set procedures if a source is lost.
- Formation evaluation
- Measuring and interpreting the properties of rocks and fluids around a well.
- Wireline logging
- Logging with tools lowered on an electrical cable after a hole section is drilled.
- Logging while drilling
- Measuring formation properties with sensors in the drill string during drilling.
- Log header
- The section of a log print that records well, mud, tool and temperature information.
- Depth matching
- Shifting logs or core so that the same rock layer appears at the same depth.
- Net pay
- The thickness of rock that meets reservoir and hydrocarbon criteria and is expected to produce.
Practice problems
Work each problem on paper first, then reveal the answer to check.
Why do logging engineers record the main pass while pulling the tool up?
Show answer
Cable tension is steady, so depth is more reliable.
Which curve is most often used for depth matching?
Show answer
The gamma ray.
Name two measurements that need a radioactive source.
Show answer
Density and neutron porosity.
What does a formation tester measure that resistivity cannot?
Show answer
Formation pressure, which gives fluid gradients and contacts.
Lesson quiz · 5 questions
Score 60% or more to complete this lesson.
Create a free account to save your progress, take quizzes and earn a certificate.