
PET-320 · Lesson 8 of 12 · 18 min
Gas reservoir material balance
Midway through the study, the company asks Lena's team for a quick review of the Birch Coulee gas pool, bought last year from another operator with five years of production history. 'The seller's reserves report used the volumetric gas in place,' Lena tells Ethan. 'Our own volumetric estimate in lesson 2 came to about 3.4 billion m³. Before we book anything, I want the material balance. For gas it is the most trusted method there is, if the data are good.'
Gas reservoirs are simpler than oil reservoirs in one important way: there is usually one phase in the reservoir, and gas is so compressible that its expansion dominates every other energy source. That makes the material balance for a gas reservoir a nearly perfect straight line when the assumptions hold, and a sensitive detector of water influx or other energy when they do not. This lesson develops the gas material balance, the p/z plot, and its main complications.
The volumetric gas material balance
For a gas reservoir with no water influx and negligible rock and water expansion, the pore volume occupied by gas stays constant. The gas initially in place, G standard volumes, occupied the pore volume at the initial formation volume factor Bgi. After producing Gp standard volumes, the remaining G − Gp occupies the same pore volume at the current Bg.
Because Bg is proportional to z/p at constant temperature, the equation rearranges into a straight line in p/z.
A plot of p/z against cumulative gas production Gp is therefore a straight line that starts at pi/zi and reaches zero at Gp = G. Extrapolating the line to p/z = 0 gives the gas in place. Extrapolating it to the abandonment p/z gives the recoverable gas. This is the p/z plot, the best known diagnostic in reservoir engineering.
Building the p/z plot
Each point needs an average reservoir pressure, usually from a shut-in test corrected to a datum depth, its z-factor from the gas composition (lesson 3), and the cumulative gas produced to that date, including any gas used as fuel or flared upstream of the sales meter. The z-factor is evaluated at reservoir temperature, which is assumed constant.
# Gas material balance: the p/z plot for a volumetric gas reservoir, with Hall-Yarborough z factors
import math
SI = True
def z_hy(Tpr, Ppr):
    t = 1.0 / Tpr; A = 0.06125 * t * math.exp(-1.2 * (1 - t) ** 2)
    B = t * (14.76 - 9.76 * t + 4.58 * t * t); Cc = t * (90.7 - 242.2 * t + 42.4 * t * t); D = 2.18 + 2.82 * t
    y = 0.001
    for _ in range(100):
        f = -A * Ppr + (y + y*y + y**3 - y**4) / (1 - y) ** 3 - B * y * y + Cc * y ** D
        df = (1 + 4*y + 4*y*y - 4*y**3 + y**4) / (1 - y) ** 4 - 2 * B * y + Cc * D * y ** (D - 1)
        y -= f / df
    return A * Ppr / y
gg = 0.65; Tpc = 169.2 + 349.5 * gg - 74.0 * gg ** 2; Ppc = 756.8 - 131.0 * gg - 3.6 * gg ** 2   # Sutton, psia and R
T = 167 + 459.67
if SI:   # pressure kPa, cumulative gas 10^6 m3
    hist = [(21000, 0.0), (19560, 192.0), (18100, 416.0), (16580, 640.0), (15200, 864.0), (13800, 1088.0)]
    psi = lambda p: p / 6.895; gu, pu, p_ab = "10^6 m3", "kPa", 2000.0
else:    # pressure psia, cumulative gas Bcf
    hist = [(3050, 0.0), (2835, 6.9), (2612, 14.95), (2422, 23.0), (2198, 31.05), (1994, 39.1)]
    psi = lambda p: p; gu, pu, p_ab = "Bcf", "psia", 300.0
xs, ys = [], []
print(f" pressure    z     p/z ({pu})   Gp ({gu})")
for p, gp in hist:
    zz = z_hy(T / Tpc, psi(p) / Ppc)
    xs.append(gp); ys.append(p / zz)
    print(f" {p:7,.0f}  {zz:.3f}  {p/zz:9,.0f}   {gp:7,.1f}")
n = len(xs); mx = sum(xs) / n; my = sum(ys) / n
b = sum((x - mx) * (y - my) for x, y in zip(xs, ys)) / sum((x - mx) ** 2 for x in xs); a = my - b * mx
G = -a / b
print(f"straight line: p/z = {a:,.0f} {b:+.3f} Gp; gas in place G = {G:,.0f} {gu}")
z_ab = z_hy(T / Tpc, psi(p_ab) / Ppc)
gp_ab = G * (1 - (p_ab / z_ab) / a)
print(f"at an abandonment pressure of {p_ab:,.0f} {pu}: recovery {gp_ab:,.0f} {gu} = {gp_ab/G:.0%} of gas in place")pressure z p/z (kPa) Gp (10^6 m3) 21,000 0.876 23,974 0.0 19,560 0.871 22,466 192.0 18,100 0.867 20,868 416.0 16,580 0.866 19,140 640.0 15,200 0.867 17,523 864.0 13,800 0.871 15,848 1,088.0 straight line: p/z = 23,940 -7.445 Gp; gas in place G = 3,216 10^6 m3 at an abandonment pressure of 2,000 kPa: recovery 2,940 10^6 m3 = 91% of gas in place
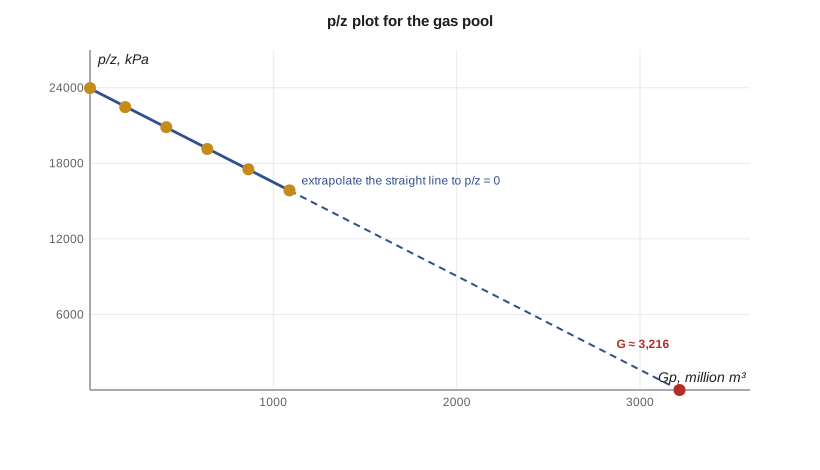
The six points from the Birch Coulee gas pool fall on a straight line within the scatter expected from pressure tests. The line extrapolates to a gas in place of about 3.22 billion m³, about 5 percent below the volumetric 3.37 billion m³. Recovery to an abandonment pressure of 2,000 kPa is about 2.94 billion m³, or 91 percent. Lena considers the two estimates consistent: the small difference could be a slightly smaller connected area or a slightly higher water saturation than the maps assume, and it is well within the volumetric range.
What the shape of the p/z plot tells you
A straight p/z line means the reservoir behaves volumetrically: no significant influx and negligible rock compressibility. Departures from a straight line are diagnostic, and the most important is upward curvature. If water influx is supporting the pressure, p/z falls more slowly than the volumetric line, the points bend upward, and an early straight-line extrapolation through them overestimates G. Unfortunately, influx often looks linear for a long time before the curvature becomes obvious, so engineers check for it by other means too, such as the trend of the apparent gas in place, G calculated point by point, which rises with time when influx is acting.
Downward curvature can mean poorer communication than assumed, with parts of the reservoir depleting more slowly, so that measured pressures from wells in the depleted part are lower than the true average. It can also mean that the pressures were measured before stabilizing, which is common in low-permeability reservoirs.
Overpressured gas reservoirs
In abnormally pressured gas reservoirs, the rock and connate water compressibilities are no longer negligible, because the initial pressure is high and the pore volume shrinks noticeably as pressure falls. The p/z plot then shows two straight lines: an early, flatter segment where compaction supports pressure, and a later, steeper segment. Extrapolating the early segment overestimates G, sometimes by a large factor. Methods such as that of Ramagost and Farshad add a correction term for the effective compressibility.
Here the bar on ce indicates the average effective compressibility of rock and water over the pressure interval. Engineers working with overpressured gas use this corrected form, or a full material balance, before booking reserves from p/z extrapolation.
Water influx in gas reservoirs
With water influx, the gas material balance becomes G (Bg − Bgi) + We = Gp Bg + Wp Bw. Rearranged in the Havlena-Odeh form, F/Eg = G + We/Eg, where F = Gp Bg + Wp Bw and Eg = Bg − Bgi. Plotting F/Eg against Gp shows a horizontal line for a volumetric reservoir and a rising curve with influx, the gas equivalent of lesson 5's diagnostic. Once an aquifer model is chosen, a plot of F/Eg against We/Eg should be a straight line with intercept G and slope one.
Water-drive gas reservoirs need careful management. Producing them faster can reduce the gas trapped by the advancing water, because the water has less time to advance before the reservoir reaches abandonment pressure. Some operators also produce water from down-dip wells to slow the advance. Both strategies must be weighed against the extra cost of water handling.
Gas in place and reserves
Because gas recoveries are high and the p/z method is robust in volumetric reservoirs, gas reserves are often booked largely from material balance once enough history exists. The Alberta Energy Regulator (AER) also collects pressure and production data from pools, and its own pool records can provide independent pressure points. Under COGEH, the evaluator documents the method and the uncertainty, and higher-confidence categories are used only where the history supports them.
For tight and shale gas, where pressure does not stabilize and the drained volume grows with time, p/z extrapolation is unreliable, and engineers rely instead on decline analysis and rate-transient methods (lesson 12 and later courses).
Abandonment pressure and recovery
Gas recovery depends strongly on the abandonment pressure, the reservoir pressure at which the wells can no longer deliver gas economically into the sales system. Lowering it, by installing field compression to reduce wellhead pressure or by removing liquids that load up the wells, adds reserves directly. A compression project that lowers the abandonment p/z from 20 percent to 10 percent of its initial value adds 10 percent of the gas in place to recovery in a volumetric reservoir, which is why compression is one of the most common gas field investments.
Worked problem
Gas in place from two p/z points
A volumetric gas pool had pi = 24,000 kPa with zi = 0.90. After 600 million m³ of production, p = 18,000 kPa and z = 0.87. Estimate G and the recovery if abandonment p/z is 2,500 kPa.
Show solution
- pi/zi = 24,000/0.90 = 26,667 kPa; p/z = 18,000/0.87 = 20,690 kPa.
- 1 − Gp/G = 20,690/26,667 = 0.7759, so Gp/G = 0.2241.
- G = 600/0.2241 = 2,677 million m³ (about 2.68 billion m³).
- At abandonment, Gp/G = 1 − 2,500/26,667 = 0.906, so recovery is about 2,426 million m³.
Answer: G ≈ 2.68 billion m³; about 91 percent recoverable.
Gas condensate and wet gas reservoirs
The p/z method applies to single-phase gas. For a wet gas, which stays gas in the reservoir but yields liquid at surface, the produced gas volume Gp must include the gas equivalent of the produced condensate and water vapour, converted from liquid volumes using their molecular weights and densities. Leaving the liquids out understates the withdrawal and overstates the gas in place. For a gas condensate below its dew point, liquid drops out in the reservoir, and the single-phase z-factor must be replaced by a two-phase z-factor measured in a constant volume depletion experiment (PET-260). The deep Tamarack condensate pool is analysed that way.
Monitoring a gas reservoir
Because the p/z method depends on good average pressures, gas operators plan regular shut-in surveys, typically once a year in key wells, timed so the wells are shut in long enough to stabilize. Permanent downhole gauges reduce the need for shut-ins. Engineers update the p/z plot after each survey, recompute the apparent gas in place, and watch for any trend. A rising trend is the earliest reliable sign of water influx, often appearing years before water reaches the wells.
For the Birch Coulee gas pool, Lena asks Ethan to recommend one change to the operator's monitoring, which had surveyed only two wells each year. He suggests adding the down-dip well to the survey program: if an aquifer exists, its pressure will show the influence first.
Common mistakes
MistakeExtrapolating an early p/z line in an overpressured reservoir.
InsteadEarly compaction support flattens the line; correct for effective compressibility.
MistakeAssuming a straight early trend rules out water influx.
InsteadInflux curvature often appears late; also watch the apparent gas in place and water production.
MistakeUsing flowing or unstabilized pressures.
InsteadUse stabilized shut-in pressures corrected to a datum.
MistakeForgetting fuel and flared gas in Gp.
InsteadGp must include all gas withdrawn from the reservoir.
MistakeApplying p/z to shale gas.
InsteadPressure does not stabilize in tight rock; use decline and rate-transient methods.
Summary and key terms
- For a volumetric gas reservoir, G Bgi = (G − Gp) Bg, giving a straight line of p/z against Gp.
- Extrapolating to p/z = 0 gives G; to the abandonment p/z gives recoverable gas.
- Upward curvature signals water influx; early extrapolation then overestimates G.
- Overpressured reservoirs need a compressibility correction.
- The Havlena-Odeh form F/Eg against Gp diagnoses influx in gas reservoirs.
- Lowering the abandonment pressure with compression adds reserves.
- p/z plot
- A plot of average pressure divided by z against cumulative gas production.
- Volumetric gas reservoir
- A gas reservoir with no water influx and negligible rock and water expansion.
- Apparent gas in place
- G calculated from each individual p/z point; it rises with time when influx acts.
- Abnormally pressured reservoir
- A reservoir with pore pressure well above or below hydrostatic.
- Abandonment pressure
- The reservoir pressure at which production is no longer economic.
- Field compression
- Compressors that lower wellhead pressure and so increase gas recovery.
Practice problems
Work each problem on paper first, then reveal the answer to check.
Why is the gas material balance more reliable than the oil material balance above the bubble point?
Show answer
Gas expansion is large, so pressure errors cause much smaller errors in G.
The apparent gas in place calculated from successive p/z points rises steadily. What do you suspect?
Show answer
Water influx, or another energy source, supporting the pressure.
How does lowering the abandonment p/z from 25 to 15 percent of pi/zi change recovery in a volumetric reservoir?
Show answer
Recovery rises from 75 to 85 percent of G.
Why can producing a water-drive gas reservoir faster improve recovery?
Show answer
The water advances less before abandonment, trapping less gas.
Lesson quiz · 5 questions
Score 60% or more to complete this lesson.
Create a free account to save your progress, take quizzes and earn a certificate.