
PET-320 · Lesson 4 of 12 · 19 min
Rock properties for reservoir engineering
With the fluid tables in hand, Ethan turns to the rock. PET-250 taught him how porosity, permeability, saturation, capillary pressure and relative permeability are measured on core. Lena wants something different now. 'For this study I don't need every plug,' she says. 'I need the handful of rock numbers that the reservoir equations actually use, with a sensible average and a range for each, and I need to know which ones matter most for each question we ask.'
This lesson reviews the rock properties that enter reservoir engineering calculations: porosity and its compressibility, permeability and how it is averaged, saturation endpoints, capillary pressure, and relative permeability. It then shows how they combine into the effective compressibility used in material balance and the mobility ratio used in displacement.
Porosity and pore compressibility
Porosity sets the pore volume, which sets the hydrocarbon volume. For reservoir engineering, the relevant porosity is the effective porosity, the connected pore space that can hold movable fluids. Porosity also changes slightly with pressure. As fluids are produced and pore pressure falls, the effective stress on the rock grains rises and the pore space compacts a little. The pore volume compressibility, cf, measures this: the fractional change in pore volume per unit change in pore pressure.
Pore compressibility is best measured on core under reservoir stress. When no measurement exists, correlations such as Hall's estimate it from porosity for consolidated sandstones and limestones. Typical values are 4 × 10⁻⁷ to 1.5 × 10⁻⁶ per kPa (3 × 10⁻⁶ to 10 × 10⁻⁶ per psi) for consolidated rock, and much higher, ten times or more, for unconsolidated sands and chalks. In an undersaturated oil reservoir, pore compressibility can supply as much drive energy as the oil itself, so it should never be left out of a material balance.
Effective compressibility
Above the bubble point, the drive energy of an oil reservoir without an aquifer comes from three expansions: the oil, the connate water and the pore volume shrinking. Combining them, weighted by the volume each occupies, gives the effective compressibility of the oil zone. Dividing by the oil saturation expresses it per unit of oil volume.
With ce known, the fraction of the oil in place that can be produced by expansion alone, from the initial pressure to the bubble point, is approximately ce (pi − pb). Because compressibilities are small, this is usually only a few percent of the oil in place, and much less where the initial pressure is close to the bubble point. It is the reason undersaturated reservoirs without aquifer support lose pressure quickly in their early life.
Permeability for reservoir calculations
Permeability controls flow rates. The absolute permeability measured on core with a single fluid must be adjusted before it is used: Klinkenberg-corrected for gas measurements, reduced to reservoir stress, and compared with permeability from well tests, which measure the effective permeability of the rock around the well at reservoir conditions. Where they differ, the well test value is usually preferred for flow calculations, because it averages a much larger volume and includes natural fractures and thin high-permeability streaks that core may miss.
Averaging depends on the flow geometry, as PET-250 showed. For layers in parallel, flow to a well through each layer side by side, the thickness-weighted arithmetic average applies, and the product kh, the flow capacity, is what matters. For layers in series, flow across beds, the harmonic average applies and low-permeability barriers dominate. Vertical permeability is often far lower than horizontal because of thin shale laminations, and the ratio kv/kh controls gravity drainage, coning and the performance of horizontal wells.
Lesson 9 shows that a well's productivity is proportional to kh. When a few thin layers hold most of the flow capacity, as is common, they also take most of the injected water in a waterflood, and they will water out first. Reservoir engineers therefore care not only about the average permeability but about its variation, measured, for example, by the Dykstra-Parsons coefficient.
Saturation endpoints
Several saturations bound the movable fluid. The connate or irreducible water saturation, Swc, is the water held in small pores and on grain surfaces that will not flow. The residual oil saturation to water, Sor, is the oil left trapped as isolated droplets behind a waterflood front. The critical gas saturation, Sgc, is the free gas saturation that must build up before gas can flow; below it, gas bubbles are isolated. The residual oil to gas, Sorg, applies where gas displaces oil.
These endpoints set the limits of recovery. In a water-swept region the most oil that can be recovered is the movable oil, 1 − Swc − Sor, as a fraction of pore volume, or (1 − Swc − Sor)/(1 − Swc) as a fraction of the oil originally there. That ratio is the maximum displacement efficiency. With Swc of 0.30 and Sor of 0.25, it is 64 percent, before any losses from incomplete sweep.
Capillary pressure
Capillary pressure, the pressure difference between the non-wetting and wetting phases across curved interfaces in the pores, controls how saturation varies with height above the free water level. In a water-wet rock, water saturation is high in a transition zone just above the free water level and falls with height to Swc. The thickness of the transition zone depends on pore size: a few metres or feet in good sandstone, tens of metres in tight rock. Capillary pressure measured in the laboratory with mercury or air is converted to reservoir conditions using the ratio of interfacial tension and contact angle, then to height using the density difference between the fluids (PET-250).
For volumetric estimates, capillary pressure explains why saturation must be averaged with height. For displacement, it smears the waterflood front over a short distance, though at field scale this effect is usually small compared with viscous forces.
Relative permeability
When two or more fluids flow together, each moves through only part of the pore space, and its permeability is reduced. The relative permeability, kr, is the effective permeability to a phase divided by a base permeability, and it depends mainly on saturation. For oil and water in a water-wet rock, krw rises from zero at Swc to an endpoint value at 1 − Sor, while kro falls from its endpoint at Swc to zero at 1 − Sor. Relative permeability is measured on core by steady-state or unsteady-state floods, or estimated from correlations.
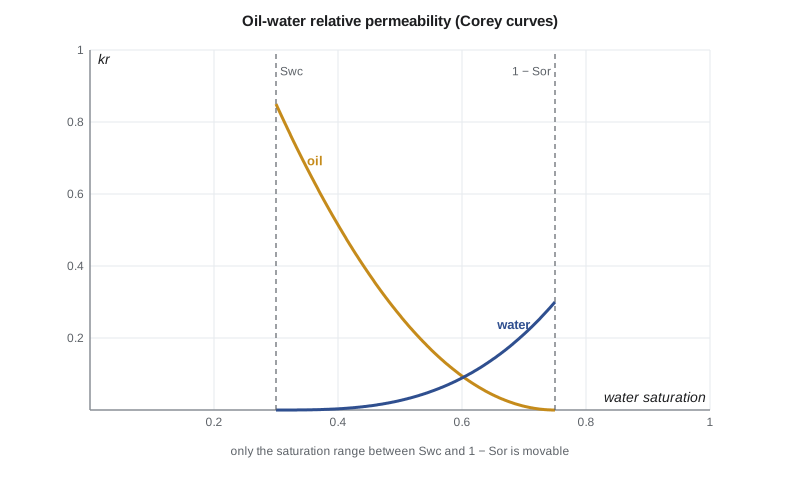
For engineering work, measured curves are often fitted with Corey-type functions, which use a normalized saturation between the endpoints and an exponent for each phase. They are smooth, easy to adjust in history matching, and need only four numbers per phase pair: two endpoints and two exponents.
Mobility and mobility ratio
A phase's mobility is its effective permeability divided by its viscosity, λ = k kr/μ. The mobility ratio of a waterflood compares the mobility of the displacing water behind the front with that of the oil ahead of it, often estimated from endpoint values. A mobility ratio below about one is favourable: water does not outrun the oil and the front stays stable. A high ratio, common with viscous oil, lets water finger through the oil, giving early breakthrough and poor sweep (lesson 11).
# Rock properties for reservoir engineering: compressibility, effective compressibility and Corey relative permeability
SI = True
phi, swc, sor = (0.14, 0.30, 0.25) if SI else (0.08, 0.35, 0.30)
cf = 1.782e-6 / phi ** 0.438              # Hall's correlation for consolidated sandstone, 1/psi (approximate)
co, cw = (1.4e-5, 3.0e-6) if SI else (1.5e-5, 3.0e-6)
ce = (co * (1 - swc) + cw * swc + cf) / (1 - swc)
f = 1 / 6.895                              # 1/psi to 1/kPa
if SI:
    print(f"pore compressibility cf = {cf*f:.2e} 1/kPa; effective compressibility ce = {ce*f:.2e} 1/kPa")
else:
    print(f"pore compressibility cf = {cf:.2e} 1/psi; effective compressibility ce = {ce:.2e} 1/psi")
dp = (15300 - 12800) / 6.895 if SI else 5370 - 2600
print(f"oil expelled by expansion alone from initial pressure to the bubble point: {100*ce*dp:.1f} % of oil in place")
# Corey oil-water relative permeability
krw0, kro0, nw, no = (0.30, 0.85, 3.0, 2.0) if SI else (0.25, 0.70, 3.0, 2.5)
mu_o, mu_w = (0.72, 0.45) if SI else (0.35, 0.30)
def kr(sw):
    s = (sw - swc) / (1 - swc - sor)
    s = min(max(s, 0.0), 1.0)
    return krw0 * s ** nw, kro0 * (1 - s) ** no
print("  Sw    krw    kro")
for i in range(6):
    sw = swc + i * (1 - swc - sor) / 5
    a, b = kr(sw); print(f" {sw:.2f}  {a:.3f}  {b:.3f}")
M = (krw0 / mu_w) / (kro0 / mu_o)
print(f"endpoint mobility ratio M = {M:.2f} ({'favourable' if M <= 1 else 'unfavourable'} for a waterflood)")
print(f"movable oil fraction of pore volume: {1 - swc - sor:.2f}; maximum displacement efficiency {(1-swc-sor)/(1-swc):.0%}")pore compressibility cf = 6.11e-07 1/kPa; effective compressibility ce = 3.09e-06 1/kPa oil expelled by expansion alone from initial pressure to the bubble point: 0.8 % of oil in place Sw krw kro 0.30 0.000 0.850 0.39 0.002 0.544 0.48 0.019 0.306 0.57 0.065 0.136 0.66 0.154 0.034 0.75 0.300 0.000 endpoint mobility ratio M = 0.56 (favourable for a waterflood) movable oil fraction of pore volume: 0.45; maximum displacement efficiency 64%
For the Cardium A pool, Hall's correlation gives a pore compressibility of about 6.1 × 10⁻⁷ per kPa and an effective compressibility of about 3.1 × 10⁻⁶ per kPa. With only 2,500 kPa between the initial pressure and the bubble point, expansion alone could produce less than 1 percent of the oil, which explains why the pool's pressure fell so quickly in its first years. The endpoint mobility ratio is about 0.56, favourable for a waterflood, and the maximum displacement efficiency is 64 percent.
Which rock numbers matter most
Different questions are sensitive to different properties. Oil in place depends on porosity, saturation and thickness. Early pressure decline in an undersaturated reservoir depends on compressibility. Well rates depend on kh and skin. Waterflood performance depends on relative permeability, mobility ratio and the variation of permeability between layers. Ultimate recovery depends on the saturation endpoints. Lena asks Ethan to rank the properties for each of the study's questions, so that the team spends its effort, and its next core budget, where it matters most.
Worked problem
Effective compressibility and expansion recovery
An undersaturated pool has co = 2.0 × 10⁻⁶ per kPa, cw = 4.5 × 10⁻⁷ per kPa, cf = 7.0 × 10⁻⁷ per kPa and Swc = 0.25. Its initial pressure is 20,000 kPa and its bubble point 15,000 kPa. Estimate the effective compressibility and the fraction of oil recoverable by expansion to the bubble point.
Show solution
- co So = 2.0 × 10⁻⁶ × 0.75 = 1.5 × 10⁻⁶; cw Swc = 4.5 × 10⁻⁷ × 0.25 = 1.1 × 10⁻⁷.
- Sum with cf: 1.5 × 10⁻⁶ + 0.11 × 10⁻⁶ + 0.70 × 10⁻⁶ = 2.31 × 10⁻⁶ per kPa.
- ce = 2.31 × 10⁻⁶/0.75 = 3.08 × 10⁻⁶ per kPa.
- Recovery ≈ ce (pi − pb) = 3.08 × 10⁻⁶ × 5,000 = 0.0154, about 1.5 percent.
Answer: ce ≈ 3.1 × 10⁻⁶ per kPa; about 1.5 percent of the oil.
Where the rock numbers come from in practice
In a typical study, porosity and saturation come from logs in every well, calibrated to core in a few; permeability comes from core and from well tests; compressibility and relative permeability come from a small number of special core analysis tests, often borrowed from an analogous pool when the field has none. That imbalance matters. A study may rest on hundreds of porosity values but only two relative permeability curves. Engineers therefore test the sensitivity of each forecast to the poorly known properties, and they recommend new measurements where a property both matters and is uncertain. Lena's rule is simple: spend the next core budget on the number that would change the decision.
Common mistakes
MistakeLeaving pore compressibility out of an undersaturated material balance.
InsteadPore compressibility can supply as much energy as the oil expansion; include it.
MistakeUsing an arithmetic average permeability for flow across layers.
InsteadUse the harmonic average for series flow; low-permeability barriers dominate.
MistakeUsing core permeability unchanged for well calculations.
InsteadCorrect to reservoir stress and compare with well test permeability, which averages a larger volume.
MistakeQuoting recovery as 1 − Sor.
InsteadThe maximum displacement efficiency is (1 − Swc − Sor)/(1 − Swc), and sweep reduces it further.
MistakeCalling a mobility ratio of 3 favourable.
InsteadRatios above about one are unfavourable and lead to early breakthrough.
Summary and key terms
- Pore compressibility measures how pore volume shrinks as pressure falls; it adds to drive energy.
- Effective compressibility ce = (co So + cw Swc + cf)/(1 − Swc) governs depletion above the bubble point.
- Expansion above the bubble point usually recovers only a few percent of the oil in place.
- Flow capacity kh controls well rates; arithmetic averages apply in parallel flow, harmonic in series.
- Saturation endpoints Swc, Sor and Sgc bound movable fluid and maximum recovery.
- Corey functions fit relative permeability with endpoints and exponents.
- Mobility ratio below about one favours stable displacement.
- Pore volume compressibility
- The fractional change in pore volume per unit change in pore pressure.
- Effective compressibility
- The combined compressibility of oil, connate water and pore volume, per unit oil volume.
- Flow capacity (kh)
- The product of permeability and thickness, which sets a well's productivity.
- Residual oil saturation (Sor)
- Oil left trapped after water has swept the rock.
- Critical gas saturation (Sgc)
- The free gas saturation at which gas begins to flow.
- Relative permeability
- Effective permeability to a phase divided by a base permeability.
- Mobility ratio
- Mobility of the displacing fluid divided by that of the displaced fluid.
Practice problems
Work each problem on paper first, then reveal the answer to check.
Why does a reservoir with a bubble point close to its initial pressure lose pressure quickly once production starts?
Show answer
Little expansion energy is available above the bubble point, so pressure falls until gas comes out of solution.
Two layers: 3 m at 100 mD and 2 m at 1 mD (or 10 ft and 6 ft). Which carries most flow toward a vertical well?
Show answer
The 100 mD layer, with kh about 99 percent of the total.
With Swc = 0.20 and Sor = 0.30, what is the maximum displacement efficiency?
Show answer
(1 − 0.20 − 0.30)/(1 − 0.20) = 0.625, or 62.5 percent.
An oil of 20 mPa·s (cP) is displaced by water of 0.5 mPa·s with endpoint krw 0.3 and kro 0.8. Is the mobility ratio favourable?
Show answer
M = (0.3/0.5)/(0.8/20) = 15; very unfavourable.
Lesson quiz · 5 questions
Score 60% or more to complete this lesson.
Create a free account to save your progress, take quizzes and earn a certificate.