
PET-250 · Lesson 9 of 12 · 19 min
Reservoir fluid properties
A cubic metre of oil in the Cardium reservoir does not arrive at the surface as a cubic metre of oil. By the time it reaches the stock tank at Drayton Valley, it has shrunk by about a third and released over 100 cubic metres of gas. Ethan sees the effect in the field data: wells that produced little gas at first now produce much more as reservoir pressure falls. Lena explains that rock properties are only half of the picture. 'Everything we calculate in the reservoir has to be converted to what we sell at the surface,' she says. 'And the fluid's viscosity sits right there in Darcy's law next to permeability. If we get the fluid wrong, we get the rates wrong.'
This lesson is an overview of the properties of reservoir oil, gas and water that petroleum engineers use every day. The next course, PET-260 Phase Behaviour of Reservoir Fluids, covers phase diagrams, fluid types and PVT experiments in depth; here the aim is to understand what the numbers mean and how they connect rock and fluid behaviour.
Reservoir conditions and stock-tank conditions
Reservoir fluids are at high pressure and temperature: tens of megapascals and 50 to 150 °C in typical oil reservoirs. Surface volumes are reported at standard conditions, which differ between regulators: 15 °C and 101.325 kPa in Canada, and 60 °F and 14.696 psia in the United States, conditions close enough that the difference is usually ignored. Volumes at standard conditions are called stock-tank volumes for oil and standard volumes for gas. Converting between reservoir and stock-tank volumes requires formation volume factors.
Oil: bubble point and solution gas
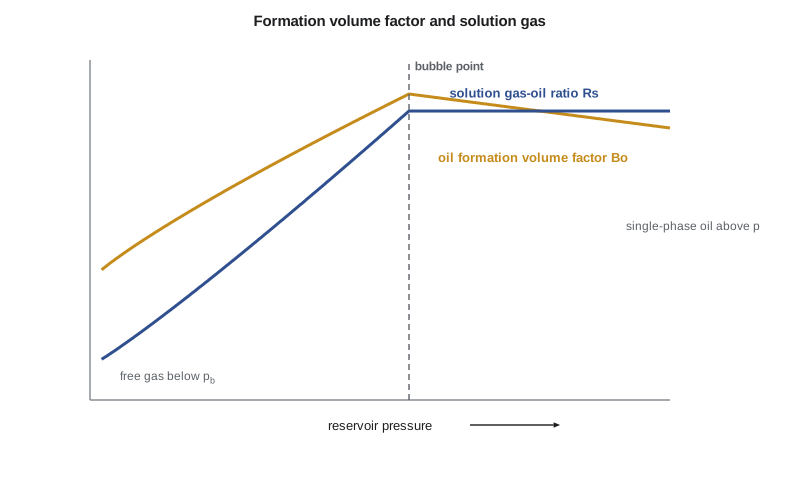
Most reservoir oils contain dissolved gas, mainly methane, ethane and propane. At high pressure the gas stays in solution. As pressure falls, there is a pressure at which the first bubble of gas appears: the bubble point pressure, pb. Above it the oil is undersaturated: it could hold more gas if more were available. Below it the oil is saturated and free gas forms in the reservoir. The amount of gas dissolved in a unit volume of stock-tank oil is the solution gas-oil ratio, Rs, measured in standard cubic metres per cubic metre or standard cubic feet per stock-tank barrel. Above the bubble point Rs is constant; below it Rs falls as gas leaves solution.
The oil formation volume factor, Bo, is the volume the oil and its dissolved gas occupy in the reservoir divided by the volume of the oil at stock-tank conditions. It is always greater than 1, because dissolved gas swells the oil and high temperature expands it. Typical values are 1.1 to 1.6 reservoir volumes per stock-tank volume, higher for oils with much dissolved gas. Above the bubble point, Bo rises slightly as pressure falls, because the oil expands; below the bubble point it falls, because gas leaves the oil and the remaining oil shrinks.
Stock-tank oil is also characterized by its density, usually expressed as API gravity: API = 141.5/SG − 131.5, where SG is specific gravity relative to water at 15.6 °C (60 °F). Water has an API gravity of 10; light oils are above about 31; heavy oils below 22; and bitumen below 10, denser than water. The Cardium oil, at about 38 to 42 API, is light.
Correlations and PVT reports
Fluid properties are best measured on representative samples in a PVT laboratory: bottomhole samples captured at reservoir pressure, or recombined separator oil and gas. The laboratory measures the bubble point, Rs and Bo against pressure, viscosity and compressibility. When samples are not available, engineers use correlations fitted to many measured oils. Standing's correlations, published in 1947 from California crude oils, are the classic examples, and dozens of later correlations such as Vasquez-Beggs and Glasø cover other regions. Correlations typically predict bubble point within 10 to 20 percent, adequate for early estimates but not for final development plans.
# Black-oil properties from Standing's correlations, and gas formation volume factor
import math
api, gas_sg, T_F = 38.0, 0.80, 165.0          # stock-tank oil gravity, gas specific gravity, reservoir temperature
oil_sg = 141.5 / (131.5 + api)

def rs_standing(p):                            # solution gas-oil ratio, scf/STB, p in psia
    return gas_sg * ((p / 18.2 + 1.4) * 10 ** (0.0125 * api - 0.00091 * T_F)) ** 1.2048
def bo_standing(rs):                           # oil formation volume factor, rb/STB
    return 0.9759 + 0.00012 * (rs * math.sqrt(gas_sg / oil_sg) + 1.25 * T_F) ** 1.2

pb = 2600.0                                    # bubble point, psia (from a PVT report)
rsb = rs_standing(pb)
print(f"oil specific gravity {oil_sg:.3f}; Rs at bubble point {rsb:.0f} scf/STB ({rsb * 0.178:.0f} m3/m3)")
print("  p (psia)   p (kPa)   Rs (scf/STB)   Bo (rb/STB)")
for p in (4000, 3000, 2600, 2000, 1200, 400):
    rs = rsb if p >= pb else rs_standing(p)
    bo = bo_standing(rs)
    if p > pb:                                 # above the bubble point oil compresses: Bo = Bob*exp(-co*(p-pb))
        bo = bo_standing(rsb) * math.exp(-12e-6 * (p - pb))
    print(f"{p:9.0f} {p * 6.895:9.0f} {rs:12.0f} {bo:13.3f}")

# gas formation volume factor Bg = 0.02827 z T / p (ft3/scf), with an assumed z
for p, z in ((2600, 0.86), (1200, 0.90), (400, 0.97)):
    bg = 0.02827 * z * (T_F + 460) / p
print(f"p {p} psia, z {z:.2f}: Bg = {bg:.5f} ft3/scf, expansion factor {1 / bg:.0f} scf per reservoir ft3")oil specific gravity 0.835; Rs at bubble point 787 scf/STB (140 m3/m3)
p (psia) p (kPa) Rs (scf/STB) Bo (rb/STB)
4000 27580 787 1.416
3000 20685 787 1.433
2600 17927 787 1.440
2000 13790 575 1.325
1200 8274 314 1.191
400 2758 88 1.085
p 2600 psia, z 0.86: Bg = 0.00584 ft3/scf, expansion factor 171 scf per reservoir ft3
p 1200 psia, z 0.90: Bg = 0.01325 ft3/scf, expansion factor 75 scf per reservoir ft3
p 400 psia, z 0.97: Bg = 0.04285 ft3/scf, expansion factor 23 scf per reservoir ft3The program uses Standing's equations for a light oil with a bubble point of 2,600 psia (about 17,900 kPa). It gives an Rs of about 790 scf/STB, or 140 m³/m³, and a Bo of 1.44 at the bubble point. Below the bubble point both fall quickly. Canadian PVT reports usually give both unit systems, and the factor 0.178 converts scf/STB to m³/m³.
Viscosity
Oil viscosity varies enormously, from a few tenths of a centipoise (millipascal-second) for light oil with much dissolved gas at reservoir conditions to thousands for heavy oil and millions for bitumen. It falls as temperature rises and, above the bubble point, rises slightly with pressure. Below the bubble point it rises as pressure falls, because the lightest components leave the oil as gas. Dead oil viscosity, measured on stock-tank oil without gas, is much higher than live oil viscosity at reservoir conditions. Viscosity appears directly in Darcy's law and in the mobility ratio, so a heavy oil reservoir can have excellent permeability yet produce slowly and sweep poorly in a waterflood.
Compressibility of oil
Above the bubble point, oil behaves as a slightly compressible liquid. Its isothermal compressibility, co, the fractional change in volume per unit change in pressure, is typically 5 to 20 × 10⁻⁶ per psi (0.7 to 3 × 10⁻⁶ per kPa). Combined with the rock compressibility from lesson 2 and the water compressibility, it gives the total compressibility that controls how fast pressure falls during primary depletion of an undersaturated reservoir and how pressure transients spread during well tests.
Gas properties
Natural gas is a mixture dominated by methane, with smaller amounts of heavier hydrocarbons and non-hydrocarbons such as nitrogen, carbon dioxide and hydrogen sulfide. At reservoir pressures gas does not obey the ideal gas law exactly. The real gas law includes the compressibility factor, z, which corrects for molecular attraction and size. At moderate pressures z is below 1, because molecules attract each other and the gas is easier to compress than an ideal gas; at very high pressures it rises above 1. It is found from charts or equations, such as the Standing-Katz chart, using pseudo-reduced pressure and temperature calculated from the gas composition or specific gravity.
The gas formation volume factor, Bg, is small: a standard cubic metre of gas occupies only a few thousandths of a cubic metre in a high-pressure reservoir. Its reciprocal, the gas expansion factor, tells how many standard volumes are produced from one reservoir volume, often 150 to 300 at typical reservoir pressures. Gas viscosity is very low, about 0.01 to 0.03 cP, which is why gas flows so easily once it is mobile and why gas reservoirs can produce at high rates even from moderate permeability.
Formation water
Formation water is often overlooked, but it matters. Its salinity, from nearly fresh to several times seawater, controls its resistivity for Archie's law, its density for pressure gradients and capillary calculations, and its tendency to form scale when mixed with injected water. Its viscosity is about 0.3 to 1 cP at reservoir conditions, falling with temperature. Its compressibility is small, about 3 × 10⁻⁶ per psi. Water analyses also tell geologists whether two reservoirs are connected, because waters that have been separated for long times usually differ in composition.
Worked problem
From reservoir barrels to stock-tank barrels
A Cardium pool has a mapped area of 260 hectares, a net pay of 6.0 m, porosity 0.15 and water saturation 0.30. Bo at initial conditions is 1.44 rm³/sm³ and Rs is 140 m³/m³. Find the original oil in place in stock-tank cubic metres and the associated solution gas.
Show solution
- Bulk volume = 260 × 10,000 × 6.0 = 1.56 × 10⁷ m³.
- Pore volume = 1.56 × 10⁷ × 0.15 = 2.34 × 10⁶ m³.
- Oil at reservoir conditions = 2.34 × 10⁶ × 0.70 = 1.64 × 10⁶ m³.
- Stock-tank oil = 1.64 × 10⁶/1.44 = 1.14 × 10⁶ m³ (about 7.2 million barrels).
- Solution gas = 1.14 × 10⁶ × 140 = 1.6 × 10⁸ m³ (about 5.6 billion cubic feet).
Answer: Dividing by Bo makes a large difference: ignoring it would overstate the stock-tank oil by 44 percent. The dissolved gas is a significant resource in its own right, and it will be produced along with the oil.
How fluid and rock properties interact
Fluid properties connect to every rock property in this course. Viscosity combines with permeability in Darcy's law and with relative permeability in mobility. Interfacial tension, which depends on fluid composition and pressure, controls capillary pressure. Polar compounds in the oil control wettability. Below the bubble point, free gas changes saturations and brings three-phase relative permeability into play. In tight reservoirs such as shales, the very small pores can even change the phase behaviour of fluids, shifting bubble points, an active research topic. A reservoir engineer has to keep both rock and fluid in view at once.
Sampling reservoir fluids
Laboratory PVT studies are only as good as the samples behind them. Bottomhole samples are collected with a sampler run on wireline to the producing interval while the well flows at a low, stable rate, so the oil enters the sampler above its bubble point and carries all of its dissolved gas. Formation testers on wireline can collect single-phase samples from several depths in an open hole before the well is completed, and they also give pressure gradients for fluid contacts. Surface samples are taken from the separator gas and liquid and recombined in the laboratory at the measured producing gas-oil ratio. Recombination is cheaper and easier, but its accuracy depends on stable separator conditions and correctly measured rates.
The key rule for sampling is to collect fluid that represents the reservoir. If the flowing bottomhole pressure falls below the bubble point near the well, gas comes out of solution and the sample will be too lean. Samples should therefore be taken early in a well's life, before reservoir pressure declines, and at low drawdown. Quality checks include comparing the opening pressure of the sampler with the bubble point, comparing two or more samples, and checking that the gas-oil ratio from the laboratory matches field measurements. Contamination by oil-based drilling mud is a common problem in formation-tester samples and must be measured and corrected.
Common mistakes
MistakeForgetting to divide reservoir oil volume by Bo.
InsteadStock-tank oil = reservoir oil volume / Bo; Bo is usually 1.1 to 1.6.
MistakeAssuming Rs keeps increasing above the bubble point.
InsteadRs is constant above pb; only when pressure falls below pb does gas leave solution.
MistakeUsing dead-oil viscosity for reservoir flow calculations.
InsteadUse live-oil viscosity at reservoir pressure and temperature.
MistakeTreating gas as ideal at reservoir pressure.
InsteadUse the compressibility factor z from charts or equations of state.
Summary and key terms
- Oil formation volume factor converts reservoir volume to stock-tank volume; solution gas-oil ratio measures dissolved gas.
- Above the bubble point oil is undersaturated and slightly compressible; below it free gas forms.
- Correlations such as Standing's estimate fluid properties when PVT data are unavailable.
- Viscosity, compressibility and formation volume factors of oil, gas and water enter every flow calculation.
- Real gas behaviour requires the compressibility factor z; gas formation volume factor is small and gas viscosity very low.
- Bubble point pressure
- The pressure at which the first gas comes out of solution as pressure falls.
- Solution gas-oil ratio
- Standard volume of gas dissolved per unit stock-tank volume of oil.
- Oil formation volume factor
- Reservoir volume of oil and dissolved gas per unit stock-tank volume of oil.
- API gravity
- An inverse measure of oil density; water is 10 API.
- Compressibility factor
- The factor z that corrects the ideal gas law for real gas behaviour.
- Gas formation volume factor
- Reservoir volume of gas per unit standard volume.
- Total compressibility
- The saturation-weighted sum of fluid compressibilities plus rock compressibility.
Practice problems
Work each problem on paper first, then reveal the answer to check.
Oil has an SG of 0.85. What is its API gravity?
Show answer
API = 141.5/0.85 − 131.5 = 166.5 − 131.5 = 35.0.
A reservoir holds 2.0 × 10⁶ m³ of oil at reservoir conditions with Bo = 1.25. How much stock-tank oil is that?
Show answer
1.6 × 10⁶ m³.
Gas at 18 MPa and 80 °C has z = 0.88. With standard conditions 101.325 kPa and 288.15 K, find Bg.
Show answer
Bg = (101.325/288.15) × 0.88 × 353.15/18,000 = 0.3516 × 0.01727 = 0.00607.
Why does oil viscosity increase as pressure falls below the bubble point?
Show answer
Light components leave the oil as gas, leaving heavier, more viscous oil behind.
Lesson quiz · 5 questions
Score 60% or more to complete this lesson.
Create a free account to save your progress, take quizzes and earn a certificate.