
PET-250 · Lesson 12 of 12 · 18 min
Special core analysis, data quality and rock typing
The final report from a commercial core laboratory in Calgary has arrived, and Lena asks Ethan to own it. The special core analysis programme on the 102/06-14 well covered capillary pressure, relative permeability, wettability, electrical properties and rock mechanics on 24 plugs selected from the 170 routine plugs. 'This is the most expensive data the company will collect on this field until the next core,' she says. 'Your job is to decide what we trust, what we question and how we carry it into the reservoir model. That means quality control first and rock typing second.' This lesson brings the course together by following that work from start to finish.
Routine and special core analysis
Routine core analysis, introduced in lesson 1, measures porosity, permeability, grain density and fluid saturations on many plugs, usually one every 30 cm or foot. It is fast and relatively cheap. Special core analysis, often called SCAL, covers measurements that take weeks or months per sample: capillary pressure, relative permeability, wettability, electrical properties for Archie's constants, pore volume compressibility, mechanical properties, NMR and mercury injection. Because SCAL is expensive, it is run on a smaller number of carefully selected plugs, and those plugs must represent the main rock types in the reservoir.
| Measurement | Lesson | Typical method | Used for |
|---|---|---|---|
| Porosity, grain density | 2 | Helium Boyle's law, summation | Pore volume, log calibration |
| Permeability | 3 | Steady-state gas with Klinkenberg correction | Flow capacity, rock typing |
| Saturation | 5 | Dean-Stark extraction | Oil in place, log calibration |
| Electrical properties | 5 | Formation factor and resistivity index | Archie constants a, m and n |
| Wettability | 6 | Amott-Harvey, USBM | Choosing test conditions, recovery |
| Capillary pressure | 7 | Porous plate, centrifuge, mercury | Saturation-height functions |
| Relative permeability | 8 | Steady-state, unsteady-state | Simulation, recovery forecasts |
| Mechanical properties | 11 | Triaxial tests | Fracture design, compaction |
Selecting samples for SCAL
Sample selection starts from routine data, core descriptions and logs. Engineers plot routine porosity against permeability, colour the points by facies or depositional environment, and pick plugs that span the range of each important rock type, with more plugs from the rock types that hold most of the oil. Plugs should be free of fractures, large shale clasts or other features that would not represent the reservoir at the plug scale. Computed tomography scans of whole core and plugs help to reject samples with hidden heterogeneity before costly tests begin. Where wettability matters, plugs are cut from preserved core sealed at the wellsite, or the laboratory restores wettability by aging cleaned plugs in crude oil at reservoir temperature.
Sister plugs, cut next to each other from the same depth, allow different tests on nearly identical rock. A capillary pressure plug and a relative permeability plug taken side by side can be combined with confidence, while plugs from different depths may belong to different rock types even if their porosities look similar.
Quality control of core data
Every core data set contains errors. Some come from the core itself: damage during drilling and retrieval, invasion by drilling fluid, stress release that opens microcracks, and drying or contamination in storage. Others come from the laboratory: cleaning that alters clays, drying that removes bound water, leaks in the apparatus, and simple transcription mistakes. Quality control looks for results that are physically impossible, inconsistent with each other or inconsistent with the logs.
Simple checks catch many problems. Grain densities should match the mineralogy: about 2.65 g/cm³ for quartz sandstone, 2.71 for limestone and 2.87 for dolomite. Higher values suggest pyrite, siderite or other heavy minerals, or a measurement error. Fluid saturations from Dean-Stark should sum close to 1 when gas is accounted for. Porosity by summation of fluids should agree with helium porosity. Permeability should form a reasonable trend against porosity within each rock type; isolated points far from the trend may be fractured plugs, plugs with shale laminae or mislabelled samples. Core depths must be shifted to log depths, because driller's depth and logger's depth can differ by a metre or more; matching core gamma ray or core porosity to the logs gives the shift.
Special core analysis needs its own checks. Capillary pressure curves should be smooth, increase as wetting phase saturation falls and reach a stable irreducible saturation. Relative permeability end points should agree with the irreducible water saturation and residual oil saturation from other tests on the same rock type. Formation factor plotted against porosity on log scales should form a straight line, and resistivity index plotted against saturation should form a straight line through the origin. Material balance in flooding tests, comparing produced volumes with injected volumes, reveals leaks and measurement drift.
Rock typing
A rock type is a group of rocks with similar pore systems, and therefore similar porosity-permeability relationships, capillary pressure curves and relative permeability curves. Rock typing is the step that links the small number of SCAL measurements to the millions of cells in a reservoir model. Each cell is assigned a rock type, and each rock type carries its own saturation-height function, relative permeability curves and Archie constants.
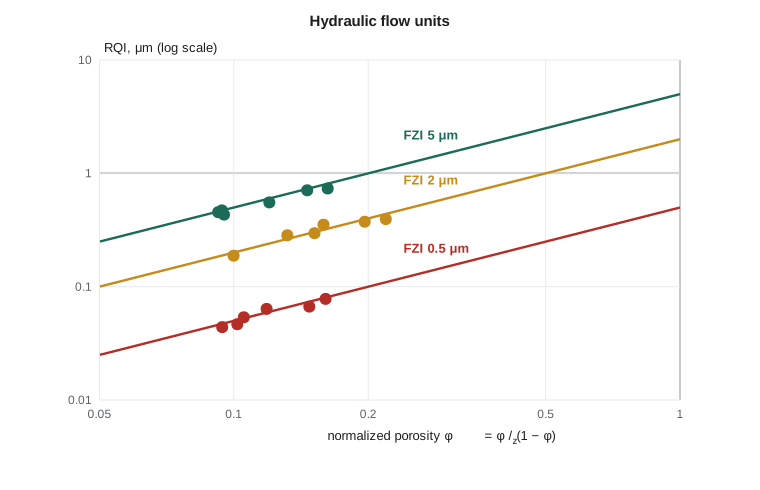
Several methods are widely used. The Winland method uses an empirical equation from mercury injection data on many sandstones and carbonates, giving the pore throat radius at 35 percent mercury saturation, r35, from porosity and permeability. Rocks are then grouped into port-size classes, from megaport rock with r35 above 10 micrometres to nanoport rock below 0.1 micrometres. The flow zone indicator method, developed by Amaefule and colleagues in 1993, calculates a reservoir quality index from the square root of permeability over porosity and divides it by the ratio of pore volume to grain volume. Rocks with the same flow zone indicator fall on a single straight line of slope 1 on a log-log plot of reservoir quality index against normalized porosity, and each line defines a hydraulic flow unit.
In the first equation, k is in millidarcies, porosity is a fraction and RQI and FZI are in micrometres. In the Winland equation, k is in millidarcies, porosity is in percent and r35 is in micrometres. Both methods rely on the idea that pore throat size controls flow, and both are only as good as the core data and the geological sense applied to them. A rock type should make geological sense, for example corresponding to a facies or diagenetic grade, so that it can be mapped between wells.
# Core data quality checks and rock typing with RQI/FZI and Winland r35
import math
# plug id, porosity (fraction), Klinkenberg permeability (mD), grain density (g/cm3), So+Sw+Sg sum
plugs = [
    ("P01", 0.182, 310.0, 2.65, 1.00), ("P02", 0.165, 140.0, 2.66, 0.99),
    ("P03", 0.151, 38.0, 2.66, 1.01), ("P04", 0.138, 12.0, 2.67, 1.00),
    ("P05", 0.121, 2.10, 2.68, 0.98), ("P06", 0.104, 0.40, 2.70, 1.00),
    ("P07", 0.092, 0.05, 2.71, 1.02), ("P08", 0.155, 0.90, 2.66, 1.00),
    ("P09", 0.143, 25.0, 2.95, 1.00), ("P10", 0.172, 95.0, 2.65, 0.91),
]
print("QC checks")
good = []
for pid, phi, k, rg, ssum in plugs:
    flags = []
    if not 2.60 <= rg <= 2.75: flags.append(f"grain density {rg:.2f} (heavy minerals or bad measurement)")
    if abs(ssum - 1) > 0.05: flags.append(f"saturations sum to {ssum:.2f}")
    if flags: print(f"  {pid}: " + "; ".join(flags))
    else: good.append((pid, phi, k))
print(f"{len(good)} of {len(plugs)} plugs pass\n")
print("plug  phi    k(mD)    RQI(um)  FZI(um)  r35(um)  port size")
for pid, phi, k in good:
    rqi = 0.0314 * math.sqrt(k / phi)
    fzi = rqi / (phi / (1 - phi))
    r35 = 10 ** (0.732 + 0.588 * math.log10(k) - 0.864 * math.log10(phi * 100))
    rt = ("mega" if r35 > 10 else "macro" if r35 > 2 else "meso" if r35 > 0.5
          else "micro" if r35 > 0.1 else "nano")
print(f"{pid} {phi:.3f} {k:7.2f} {rqi:7.3f} {fzi:7.3f} {r35:7.2f} {rt}")QC checks P09: grain density 2.95 (heavy minerals or bad measurement) P10: saturations sum to 0.91 8 of 10 plugs pass plug phi k(mD) RQI(um) FZI(um) r35(um) port size P01 0.182 310.00 1.296 5.824 12.83 mega P02 0.165 140.00 0.915 4.629 8.75 macro P03 0.151 38.00 0.498 2.801 4.39 macro P04 0.138 12.00 0.293 1.829 2.41 macro P05 0.121 2.10 0.131 0.950 0.97 meso P06 0.104 0.40 0.062 0.531 0.42 micro P07 0.092 0.05 0.023 0.228 0.14 micro P08 0.155 0.90 0.076 0.412 0.47 micro
The program first applies two checks. Plug P09 has a grain density of 2.95 g/cm³, far above the range for a quartz sandstone, so it is set aside until the laboratory confirms the value or a thin section shows heavy minerals. Plug P10 has fluid saturations that sum to only 0.91, which suggests fluid loss or a weighing error, so its saturation is not used. The remaining plugs are classified. P01 to P04 are megaport and macroport rock with flow zone indicators above about 1.8 micrometres. P05 is mesoport. P06 and P07 are microport. P08 is an interesting case: its porosity of 15.5 percent is as high as the macroport plugs, but its permeability is below 1 mD. Its pore space is dominated by small pores, probably microporosity in clay or altered grains, and it would hold more water at the same height above the free water level. Without rock typing, a porosity cutoff alone would wrongly treat P08 as good reservoir.
Worked problem
Rock typing a single plug
A plug has porosity 0.140 and permeability 46.3 mD, the Klinkenberg-corrected value from lesson 3. Calculate RQI, FZI and r35 and assign a Winland class.
Show solution
- k/φ = 46.3/0.140 = 330.7; √330.7 = 18.19.
- RQI = 0.0314 × 18.19 = 0.571 μm.
- φz = 0.140/0.860 = 0.163; FZI = 0.571/0.163 = 3.51 μm.
- log r35 = 0.732 + 0.588 log 46.3 − 0.864 log 14.0 = 0.732 + 0.588 × 1.666 − 0.864 × 1.146 = 0.732 + 0.979 − 0.990 = 0.721.
- r35 = 10^0.721 = 5.3 μm, which falls in the macroport class (2 to 10 μm).
Answer: The plug is macroport rock with a flow zone indicator of about 3.5 micrometres. It would be grouped with plugs P03 and P04 from the program, and it would share their capillary pressure and relative permeability curves in the reservoir model.
From rock types to the reservoir model
Once rock types are defined in cored wells, they must be predicted in uncored wells and between wells. Logs provide the link: porosity, clay volume, resistivity, NMR and sonic responses differ between rock types, and statistical classification methods or neural networks can be trained on the cored intervals and applied elsewhere. Geologists then distribute rock types through the model using facies maps, depositional trends and geostatistics. Each cell inherits the properties of its rock type: a porosity-permeability transform, a saturation-height function from the capillary pressure data of lesson 7, relative permeability curves from lesson 8 and Archie constants from lesson 5. The model's original oil in place and its waterflood forecast both depend directly on these choices.
Ethan's final summary for Lena groups the Cardium cores into three rock types: clean conglomerate and coarse sandstone with very high permeability, fine-grained shoreface sandstone that holds most of the oil, and silty bioturbated sandstone that is tight but extensive. He recommends repeating two relative permeability tests that failed material balance checks and adding mercury injection on the silty rock type, which had too few SCAL samples. Lena signs off on the plan and forwards it to Nadia for the reservoir model.
The reservoir model is never finished. New wells, production history and pressure data will test every rock property chosen today. A clear record of how each value was measured, checked and assigned allows the team to revisit decisions when the field tells them something new.
Common mistakes
MistakeSelecting SCAL plugs only from the best rock.
InsteadSelect plugs that cover every important rock type, weighted by the volume of oil each holds.
MistakeAccepting all laboratory results without checks.
InsteadCheck grain densities, saturation sums, porosity-permeability trends and material balance before using the data.
MistakeUsing a porosity cutoff alone to define reservoir.
InsteadUse rock typing based on pore throat size, such as FZI or r35, because high porosity can hide low permeability.
MistakeForgetting to depth-shift core data to logs.
InsteadMatch core gamma ray or porosity to logs and apply the shift before comparing.
Summary and key terms
- Special core analysis measures capillary pressure, relative permeability, wettability, electrical and mechanical properties on selected plugs.
- SCAL plugs must represent the main rock types and be checked for hidden heterogeneity before testing.
- Quality control checks grain density, saturation sums, porosity-permeability trends, curve shapes and material balance.
- Rock typing with FZI or Winland r35 groups rocks with similar pore throat sizes and flow behaviour.
- Each rock type carries its own saturation-height, relative permeability and Archie parameters into the reservoir model.
- Special core analysis (SCAL)
- Detailed laboratory measurements of multiphase, electrical and mechanical properties on selected plugs.
- Sister plugs
- Plugs cut side by side from the same depth for different tests.
- Rock type
- A group of rocks with similar pore systems and flow properties.
- Reservoir quality index (RQI)
- 0.0314 times the square root of permeability over porosity, in micrometres.
- Flow zone indicator (FZI)
- RQI divided by the pore-to-grain volume ratio; constant within a hydraulic flow unit.
- Winland r35
- The pore throat radius at 35 percent mercury saturation, estimated from porosity and permeability.
- Depth shift
- The correction that aligns core depths with log depths.
Practice problems
Work each problem on paper first, then reveal the answer to check.
A plug has a grain density of 2.84 g/cm³. Name two possible explanations.
Show answer
Dolomite or another dense mineral in the rock, or a measurement or weighing error.
Find FZI for a plug with RQI = 0.30 μm and porosity 0.20.
Show answer
φz = 0.25; FZI = 0.30/0.25 = 1.2 μm.
Two plugs both have 15 percent porosity, but permeabilities of 100 mD and 1 mD. Which has the larger r35, and how many times larger?
Show answer
The 100 mD plug; the ratio is 100^0.588, about 15 times larger.
Why should sister plugs be used for capillary pressure and relative permeability tests that will be combined?
Show answer
So that both tests describe the same rock type and their results are consistent.
Lesson quiz · 5 questions
Score 60% or more to complete this lesson.
Create a free account to save your progress, take quizzes and earn a certificate.