
PET-250 · Lesson 1 of 12 · 23 min
Reservoir rock properties and core analysis
Ethan Cardinal has spent his first year at Prairie Crest Energy Ltd. learning where oil comes from and how it is trapped. Now the questions change. Lena Haugen, the reservoir engineer who will lead the development plan for the Tamarack Lake field, drops a box of core photographs on his desk. 'Geology told us the oil is there,' she says. 'Now we need numbers. How much pore space? How easily will the oil flow? How much of it can we actually move, and how much will stay behind stuck in the rock?' The company has just cut 54 metres of core from the Cardium in the 102/06-14 well, and the plugs are on their way to a commercial core laboratory in Calgary. Over this course Ethan will follow those plugs through the laboratory and turn the measurements into the inputs a reservoir model needs.
This first lesson is a map of the subject. It introduces the handful of rock and fluid properties that control how much oil and gas a reservoir holds and how fast it can produce, explains where the numbers come from, and sets out the chain from a piece of rock in a core barrel to a value in a simulation model. Each later lesson takes one property and works through it in depth.
The properties that matter
Petroleum engineers care about a small set of properties, and each answers a practical question. Porosity, the fraction of the rock that is pore space, sets how much fluid the rock can store. Permeability, the ease with which fluid flows through the connected pores, sets how fast a well can produce and how much pressure it takes to push fluid through the rock. Fluid saturation, the fraction of the pore space filled by water, oil or gas, sets how much of the stored fluid is hydrocarbon. Together, porosity, saturation, thickness and area give the volume of oil or gas in place.
Three further properties describe how fluids share the pore space. Wettability is the tendency of one fluid, usually water or oil, to coat the grain surfaces. Capillary pressure is the pressure difference across the curved interface between two fluids in a narrow pore, and it controls how fluids are distributed vertically in a reservoir and how much water remains even high above the oil-water contact. Relative permeability describes how the ability of each fluid to flow drops when another fluid shares the pores, and it controls how much oil can be recovered by waterflooding before water takes over the flow.
Finally, the fluids themselves have properties: density, viscosity, compressibility, and how much gas is dissolved in the oil at reservoir conditions. These change with pressure and temperature, and they connect what happens in the reservoir to what arrives at the surface. Rock mechanics, the response of the rock to stress, ties everything together: as pressure falls during production, the rock compacts slightly, pore volume shrinks, and permeability may fall, while hydraulic fracturing depends entirely on the stresses in the rock.
| Property | Symbol and usual unit | Question it answers | Typical sandstone range |
|---|---|---|---|
| Porosity | φ, fraction or percent | How much can the rock store? | 0.10 to 0.30 |
| Permeability | k, millidarcy (mD) | How easily does fluid flow? | 1 to 1,000 mD |
| Water saturation | Sw, fraction of pore volume | How much of the pore space is water? | 0.15 to 0.50 in pay |
| Capillary pressure | Pc, kPa or psi | How are fluids arranged vertically? | A few to hundreds of kPa |
| Relative permeability | kr, fraction | How well does each fluid flow when sharing pores? | 0 to 1 |
| Wettability | contact angle θ or an index | Which fluid coats the grains? | water-wet to oil-wet |
| Rock compressibility | cf, per unit pressure | How much does pore volume shrink? | small but important |
Where the numbers come from
No single measurement gives every property, and each method samples a different volume of rock. Core, the cylinders of rock cut by a special bit and brought to surface in a core barrel, is the only direct sample of the reservoir. It gives the most reliable values for porosity, permeability, grain density and the special properties such as capillary pressure and relative permeability. But core is expensive, often cut in only a few wells, and samples a tiny volume: a plug 3.8 cm (1.5 in) across and 5 cm (2 in) long represents a reservoir that may cover tens of square kilometres.
Well logs, recorded by tools lowered on a cable or carried in the drill string, measure physical responses such as natural radioactivity, electrical resistivity, bulk density and the speed of sound. They sample every well and every foot of the reservoir, but they measure properties indirectly, so they must be calibrated against core. Porosity from a density log and water saturation from a resistivity log, covered in lesson 5 and in the later well logging course, depend on core-derived constants.
Pressure transient tests, in which a well is shut in or flowed at a known rate while the pressure is recorded, give an average permeability over a volume of rock tens to hundreds of metres across. That is the permeability that actually controls flow to the well, and it often differs from the average of core plugs because fractures, shale layers and heterogeneity change flow at scales a plug cannot see. Production data, finally, tell engineers how the reservoir really behaves, and every property estimate is eventually tested against it.
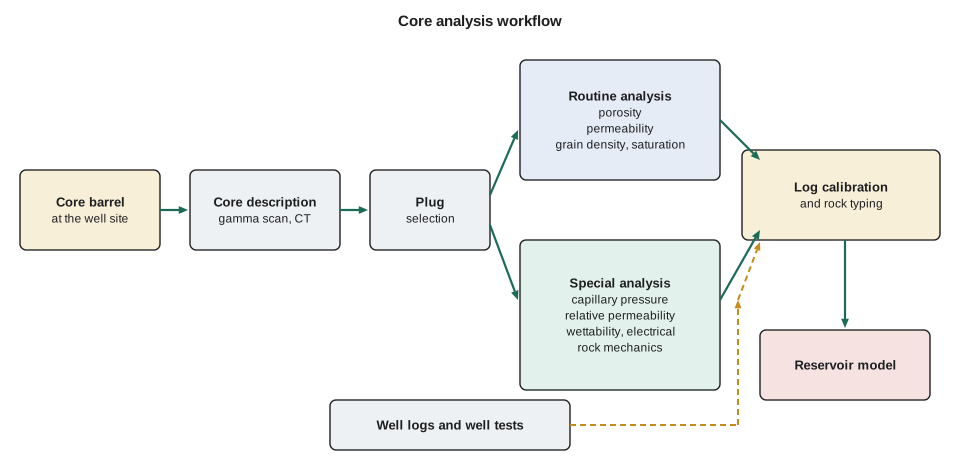
From the well to the laboratory
Coring is planned before the well is drilled. The geologist chooses the interval, usually the whole reservoir plus some of the seal and the underlying water-bearing rock, so that contacts and transitions are sampled. Drilling engineers select the core bit and barrel, typically 9 to 27 metres (30 to 90 feet) long per run, and the mud system. Water-based mud invades the core and changes its saturations; oil-based mud changes the wettability of some rocks. For a core meant to measure original water saturation, a low-invasion oil-based mud and a tracer may be used so that the laboratory can tell how much filtrate entered the rock.
At surface, the core is handled carefully. Pressure drops as the core is lifted, so dissolved gas comes out of the oil and pushes some fluid out of the rock. The core is laid out in order, marked with depth and orientation lines, photographed, and sealed or frozen to preserve fluids. Unconsolidated or friable sands may be frozen in the barrel. In the laboratory the core is scanned with a gamma-ray detector so that its depth can be matched to the logs, slabbed lengthwise, described by a geologist, and sampled with plugs at regular intervals, usually every 0.3 metres (1 foot) and at every change in rock type.
Depth matching is easy to overlook but essential. Driller's depth on the core and logger's depth on the wireline logs commonly differ by a metre or more, because of stretch in the drill pipe and cable. Matching the core gamma scan to the log gamma ray lets every plug measurement be placed against the correct log reading. Without it, core-log calibration is meaningless.
Routine core analysis
Routine core analysis, often abbreviated RCA, measures the basic properties on every plug: porosity, permeability to air or nitrogen, grain density and, on fresh preserved plugs, fluid saturations. It is relatively fast and cheap and produces the data set on which almost everything else is built.
The plugs are first cleaned. Hot solvents such as toluene and methanol are cycled through the rock in a Soxhlet or Dean-Stark apparatus to remove oil, water and salt. For fresh plugs, the Dean-Stark method measures saturation at the same time: the solvent vapour carries water out of the plug, the water condenses and collects in a calibrated trap, and the oil is found from the plug's weight loss after the water is subtracted. The cleaned plugs are dried at controlled humidity, because overheating destroys some clay minerals and changes their properties.
Grain volume is measured with a helium porosimeter, described in lesson 2, and bulk volume from calipers or mercury displacement. Porosity is the pore volume divided by bulk volume, and grain density is the dry mass divided by grain volume. Grain density is a useful check: clean quartz sandstone gives about 2.65 g/cm³, calcite 2.71, dolomite 2.87, while values outside the expected range suggest heavy minerals, pyrite, or a measurement error. Permeability is measured by flowing gas through the plug, as described in lesson 3.
# Routine core analysis for one plug: bulk volume, grain volume, porosity,
# grain density and Dean-Stark fluid saturations
import math

# plug measurements (lab units: cm, g, cm3)
diameter, length = 3.81, 5.08          # 1.5 in x 2 in plug
mass_dry = 132.47                      # g, after extraction and drying
grain_volume = 49.80                   # cm3, from a helium (Boyle's law) porosimeter
water_collected = 2.40                 # cm3 recovered in the Dean-Stark trap
mass_before, mass_after = 138.78, 132.47   # g, fresh plug and dry plug
rho_w, rho_o = 1.02, 0.84              # g/cm3, formation water and stock-tank oil

bulk = math.pi * (diameter / 2) ** 2 * length
pore = bulk - grain_volume
phi = pore / bulk
rho_g = mass_dry / grain_volume

water_mass = water_collected * rho_w
oil_mass = (mass_before - mass_after) - water_mass
oil_volume = oil_mass / rho_o
sw, so = water_collected / pore, oil_volume / pore

print(f"bulk volume   {bulk:6.2f} cm3")
print(f"pore volume   {pore:6.2f} cm3   porosity {phi:.3f}")
print(f"grain density {rho_g:.3f} g/cm3  (quartz is 2.65)")
print(f"water {water_collected:.2f} cm3, oil {oil_volume:.2f} cm3")
print(f"Sw = {sw:.2f}, So = {so:.2f}, gas or lost fluid = {1 - sw - so:.2f}")bulk volume 57.92 cm3 pore volume 8.12 cm3 porosity 0.140 grain density 2.660 g/cm3 (quartz is 2.65) water 2.40 cm3, oil 4.60 cm3 Sw = 0.30, So = 0.57, gas or lost fluid = 0.14
The program shows the arithmetic the laboratory does for every plug. The saturations do not add to 1. The missing fraction represents gas that came out of solution as the core was brought to surface, and fluid lost from the outer part of the core. Saturations measured on core are therefore rarely used directly as reservoir values; they are a check on log-derived saturations, and on fresh cores cut with oil-based mud the water saturation can be close to the true original value because water is not easily displaced.
Worked problem
Checking a plug measurement
A cleaned plug has a bulk volume of 57.9 cm³, a grain volume of 49.8 cm³ and a dry mass of 132.5 g. A second plug from 30 cm deeper reports a bulk volume of 58.1 cm³, a grain volume of 46.2 cm³ and a dry mass of 133.4 g. Calculate porosity and grain density for both and decide whether either result is suspicious.
Show solution
- Plug 1: pore volume = 57.9 − 49.8 = 8.1 cm³; porosity = 8.1/57.9 = 0.140.
- Plug 1: grain density = 132.5/49.8 = 2.66 g/cm³, close to quartz.
- Plug 2: pore volume = 58.1 − 46.2 = 11.9 cm³; porosity = 11.9/58.1 = 0.205.
- Plug 2: grain density = 133.4/46.2 = 2.89 g/cm³.
Answer: Plug 1 looks normal. Plug 2 has a grain density near dolomite or a mixture with heavier minerals, which is unusual in a quartz sandstone, and its porosity is much higher. Either the plug is genuinely a dolomitic or pyritic layer, which the geologist can confirm from the slabbed core, or the grain volume is too low because of a leak in the porosimeter. Ethan asks the laboratory to re-run the grain volume before the value enters the data set.
Special core analysis
Special core analysis, or SCAL, covers the slower, more expensive tests: capillary pressure, relative permeability, wettability, electrical properties for log interpretation, and rock mechanical properties. These tests are run on a carefully chosen subset of plugs that represent each rock type, often 20 to 60 plugs for a whole field. Some take weeks or months, because fluids must reach equilibrium at reservoir conditions. Lesson 12 returns to SCAL programs and how their results are checked and grouped.
The choice of samples matters more than the number. A SCAL program that tests only the best rock will overestimate recovery, and one that ignores the transition zone will miss how much water the wells will produce early in life. The usual approach is to group plugs into rock types first, using routine data and thin sections, and then choose SCAL plugs that span the range of each type.
Scale and representativeness
The volume of rock that each measurement represents is a recurring theme in reservoir engineering. A thin section examines a few square millimetres. A core plug represents perhaps 50 cm³. A whole-core sample, a full-diameter piece of core 10 to 30 cm long, captures centimetre-scale layering and small fractures that a plug may miss. Logs average over 0.3 to 1 metre vertically and a few tens of centimetres into the formation. A well test averages over a volume hundreds of metres across. A reservoir simulation grid block may be 50 to 200 metres on a side and several metres thick.
Properties do not average simply across these scales. Porosity is additive, so the average porosity of a grid block is just the volume-weighted average of its parts. Permeability is not: the effective permeability of a layered block depends on whether flow runs along or across the layers, as lesson 4 shows, and a few high-permeability streaks or fractures can dominate. Capillary pressure and relative permeability are even harder to scale up. Much of the craft of reservoir engineering lies in carrying small-scale measurements to the scale at which decisions are made.
For the Tamarack Lake field, Lena sets out the plan. Routine analysis on about 170 plugs from the 54 metres of core will give porosity, permeability and grain density. Twenty-four plugs chosen across four rock types will go for special analysis: mercury injection, centrifuge capillary pressure, steady-state relative permeability, wettability and electrical properties. Log analysts will use the core to calibrate porosity and saturation in the dozens of wells that have logs but no core. A pressure transient test in the cored well will provide an independent permeability.
Units
Canadian practice mixes SI and oilfield units, and engineers must be fluent in both. Depth and thickness are usually in metres, pressure in kilopascals or megapascals, volume in cubic metres, and temperature in degrees Celsius, while permeability stays in millidarcies everywhere and many correlations and industry tools still use barrels, psi and feet. Keeping track of units is not optional: a factor of 6.29 between cubic metres and barrels, or 6.895 between kilopascals and psi, appears constantly, and a missed conversion can change a volume estimate by an order of magnitude.
The darcy, the unit of permeability, deserves a note. One darcy is the permeability that lets a fluid of viscosity 1 centipoise flow at 1 cm³/s through a cross-section of 1 cm² under a pressure gradient of 1 atmosphere per centimetre. In SI terms it is about 0.987 × 10⁻¹² m², or roughly one square micrometre. Reservoir rocks are usually described in millidarcies (mD), and tight and shale rocks in microdarcies or nanodarcies.
Common mistakes
MistakeTreating core saturations as original reservoir saturations.
InsteadCore loses gas and fluid on the way to surface, and mud filtrate invades it. Use core saturations as a check, not a direct input, unless special coring methods were used.
MistakeSkipping depth matching between core and logs.
InsteadMatch the core gamma scan to the log gamma ray before calibrating any log to core data.
MistakeAveraging permeability like porosity.
InsteadPorosity is additive; permeability depends on flow direction and arrangement of layers and needs the right average.
MistakeChoosing SCAL plugs only from the best rock.
InsteadSelect plugs across every rock type, including poorer rock and the transition zone, or recovery will be overestimated.
Summary and key terms
- Porosity, permeability and saturation set how much hydrocarbon a reservoir holds and how fast it can flow; wettability, capillary pressure and relative permeability control how fluids share the pores.
- Core is the only direct sample of the reservoir; logs sample every well indirectly and must be calibrated to core; well tests average permeability over a large volume.
- Routine core analysis measures porosity, permeability, grain density and saturation on every plug; special core analysis measures capillary pressure, relative permeability, wettability and other properties on selected plugs.
- Depth matching, careful handling and preserved samples are essential for meaningful core data.
- Each measurement samples a different scale; porosity averages simply, permeability and multiphase properties do not.
- Core
- A cylinder of rock cut from the well with a special bit and brought to surface for description and testing.
- Core plug
- A small cylinder, typically 2.5 or 3.8 cm (1 or 1.5 in) in diameter, drilled from core for laboratory measurement.
- Routine core analysis
- Standard measurements of porosity, permeability, grain density and saturation on core plugs.
- Special core analysis
- Measurements of capillary pressure, relative permeability, wettability and other properties on selected plugs.
- Grain density
- The mass of the solid grains divided by their volume.
- Dean-Stark extraction
- A method that distils water out of a core sample with a solvent to measure water saturation.
- Darcy
- The unit of permeability, about 0.987 × 10⁻¹² m²; reservoir rocks are usually described in millidarcies.
Practice problems
Work each problem on paper first, then reveal the answer to check.
A plug has a bulk volume of 60.0 cm³ and a grain volume of 51.0 cm³. What is its porosity?
Show answer
φ = (60.0 − 51.0)/60.0 = 0.150.
A Dean-Stark test on a plug with 9.0 cm³ of pore volume collects 2.7 cm³ of water. What is the water saturation?
Show answer
Sw = 2.7/9.0 = 0.30.
Why might permeability from a well test be much higher than the average of core plugs from the same well?
Show answer
The test averages over a large volume and can include natural fractures or high-permeability streaks that plugs miss or that were avoided during sampling.
A sandstone plug has a grain density of 2.58 g/cm³. Suggest two explanations.
Show answer
Feldspar or clay with lower grain density, or a measurement error such as incomplete cleaning leaving residual organic matter or salt.
Lesson quiz · 5 questions
Score 60% or more to complete this lesson.
Create a free account to save your progress, take quizzes and earn a certificate.