
NUC-410 · Lesson 6 of 12 · 21 min
Probabilistic safety assessment
Darlington's probabilistic safety assessment is not one model but a family of them: internal events at power, internal fires and floods, seismic events, high winds, shutdown states and the containment response for each. Lise shows Hana the summary table of results. "People outside the field see one number and either panic or relax," she says. "The number is the least interesting part. What matters is what drives it, how uncertain it is, and what changes would reduce it. Your job this week is to learn to read a PSA the way the people who use it for decisions read it."
What a probabilistic safety assessment is
A probabilistic safety assessment, called a probabilistic risk assessment in the United States, is a systematic estimate of the frequency and consequences of accidents at a plant. It asks three questions: what can go wrong, how likely is it, and what are the consequences? The answers are built up from the methods of the last two lessons: initiating events are identified and grouped, event trees trace the plant response, fault trees quantify each safety function, and the results are combined into the frequencies of core damage, of releases and, in a full assessment, of health effects. Unlike deterministic analysis, a probabilistic assessment considers multiple failures and realistic plant behaviour, and gives a view of risk across all events at once.
The first full assessment of commercial reactors was the Reactor Safety Study, WASH-1400, published by the US Nuclear Regulatory Commission in 1975. It found that accident risk was dominated not by the large pipe breaks that had shaped the design basis but by small breaks and transients combined with multiple failures and human errors. The Three Mile Island accident four years later followed a sequence of exactly that kind, a small loss of coolant through a stuck-open valve combined with operator misdiagnosis, and the methods became standard tools worldwide.
Three levels
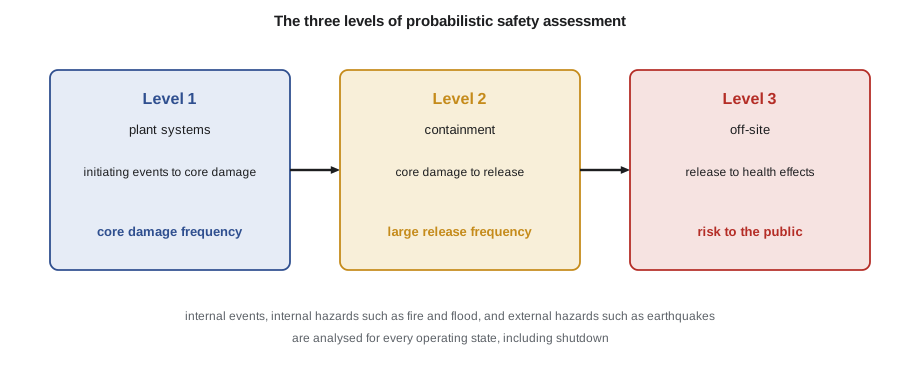
A Level 1 assessment covers the sequence from initiating events to core damage and produces the core damage frequency, with the dominant sequences and contributors. A Level 2 assessment takes the core damage sequences, grouped into plant damage states, and models the progression of the severe accident in the reactor and containment: the timing and mode of vessel failure, the loads on containment from pressure, hydrogen and molten core, and the performance of containment systems. Its outputs are the frequencies of release categories, defined by the size, timing and composition of the release. A Level 3 assessment models the atmospheric dispersion of each release category, the exposure of the population, the effect of protective actions and the resulting health and economic consequences.
CNSC REGDOC-2.4.2 requires a Level 1 and Level 2 probabilistic safety assessment for each reactor facility, covering internal events, internal and external hazards, and all operating modes, and requires it to be updated periodically. It also requires the assessment to address the site, including multiple units and the spent fuel, rather than just one reactor.
Risk metrics
The most widely used risk metrics are core damage frequency, which measures how often the core is expected to be seriously damaged, and a release frequency, which measures how often a release of a defined size occurs. Release frequency is defined differently in different countries: as large release frequency, large early release frequency or by explicit release limits of a reference isotope such as caesium-137. Level 3 metrics include individual risk of early and latent fatality, and collective measures such as person-sieverts or land contamination.
| Metric | Typical goal or target | Comment |
|---|---|---|
| Severe core damage frequency | about 10⁻⁴ per unit-year for existing units; about 10⁻⁵ for new designs | utility targets and REGDOC-2.5.2 goals |
| Small release frequency | about 10⁻⁵ per unit-year for new designs | release of a defined quantity of iodine or caesium |
| Large release frequency | about 10⁻⁵ per unit-year for existing units; about 10⁻⁶ for new designs | release large enough to need long-term relocation |
Importance measures
A probabilistic assessment of a real plant contains thousands of basic events and tens of thousands of minimal cut sets. Importance measures summarise which of them matter. The Fussell–Vesely importance of a basic event is the fraction of the total risk that comes from cut sets containing that event: it measures how much risk would be removed if the event became impossible. The risk achievement worth is the ratio of the risk with the event assumed to have occurred to the base risk: it measures how much the risk would rise if a component were taken out of service or failed. A component with high risk achievement worth needs strong assurance; a component with high Fussell–Vesely importance is a good target for improvement.
# Aggregate core damage frequency and compute importance measures for basic events.
# Each cut set lists basic events; CDF ~ sum of cut set frequencies (rare-event).
p = {"IE_LOOP": 3e-2, "IE_SLOCA": 5e-4, "DG_A": 3e-2, "DG_B": 3e-2, "CCF_DG": 2e-3,
     "AFW": 1e-3, "HPI": 2e-3, "OPER": 5e-3}
cutsets = [("IE_LOOP", "CCF_DG", "OPER"), ("IE_LOOP", "DG_A", "DG_B", "OPER"),
           ("IE_SLOCA", "HPI"), ("IE_LOOP", "AFW", "OPER")]
def f(cs, q=p):
    r = 1.0
    for e in cs: r *= q[e]
    return r
cdf = sum(f(c) for c in cutsets)
print(f"total CDF {cdf:.2e} per reactor-year")
for ev in ["CCF_DG", "DG_A", "HPI", "AFW", "OPER"]:
    fv = sum(f(c) for c in cutsets if ev in c) / cdf
    q1 = dict(p); q1[ev] = 1.0
    raw = sum(f(c, q1) for c in cutsets) / cdf
print(f"{ev:7s} Fussell-Vesely {fv:5.2f} risk achievement worth {raw:8.1f}")total CDF 1.59e-06 per reactor-year CCF_DG Fussell-Vesely 0.19 risk achievement worth 95.4 DG_A Fussell-Vesely 0.09 risk achievement worth 3.8 HPI Fussell-Vesely 0.63 risk achievement worth 315.8 AFW Fussell-Vesely 0.09 risk achievement worth 95.5 OPER Fussell-Vesely 0.37 risk achievement worth 74.4
In this toy model, high-pressure injection has the largest Fussell–Vesely importance because the small-break sequence dominates. The common-cause failure of the diesel generators and the auxiliary feedwater system both have high risk achievement worth: either one being unavailable would raise the core damage frequency almost a hundredfold, because the remaining cut sets would then depend only on the loss of off-site power and an operator action. The operator action appears in several cut sets and has both a substantial Fussell–Vesely importance and a high risk achievement worth, a common finding that points to procedures and training.
Uncertainty
Every input to a probabilistic assessment is uncertain, and the result is a probability distribution rather than a single number. Aleatory uncertainty is the randomness of the events themselves, which the model represents by probabilities. Epistemic uncertainty is the analyst's lack of knowledge about the parameters, models and completeness of the analysis. Parameter uncertainty is propagated by sampling the input distributions, typically lognormal for failure rates, and running the model many times to give a distribution of core damage frequency, often reported as mean, median and 5th and 95th percentiles. The mean is usually used for comparison with goals because it reflects the whole distribution.
Model uncertainty, such as the choice of success criteria, the treatment of a phenomenon or the human reliability method, is handled by sensitivity studies. Completeness uncertainty, the possibility that something important has been left out, cannot be quantified directly. It is addressed by peer review, by comparing with operating experience and with other plants' assessments, and by keeping deterministic defence in depth alongside the probabilistic results. A probabilistic assessment does not replace engineering judgement; it informs it.
Worked problem
Lognormal mean and median
A failure rate has a median of 1 × 10⁻⁴ per hour and an error factor of 10 (the ratio of the 95th percentile to the median). Estimate the mean.
Show solution
- For a lognormal, error factor EF = exp(1.645σ), so σ = ln 10/1.645 ≈ 1.40.
- Mean = median × exp(σ²/2) = 1 × 10⁻⁴ × exp(0.98) ≈ 2.7 × 10⁻⁴ per hour.
- The mean is almost three times the median because the distribution is skewed.
Answer: The mean is about 2.7 × 10⁻⁴ per hour.
Hazards and operating modes
Early assessments covered only internal events at full power, but experience showed that other contributors can be as large or larger. Internal fires can damage cables of redundant trains in one area and cause spurious actuations; fire assessments trace cable routes and fire scenarios through every room. Internal floods from pipe failures can submerge equipment. Seismic assessments combine the site hazard curve with the fragility of each component, expressed as the probability of failure as a function of ground acceleration. High winds, external floods and other external hazards are treated in the same way. Shutdown and low-power states have different configurations, with systems out for maintenance and open primary systems, and their risk is assessed separately.
Canadian assessments also cover the irradiated fuel bays and, increasingly, the whole site including all units, because a single external hazard can affect all four Darlington units at once.
Using a probabilistic assessment
Probabilistic assessments are used for many decisions beyond licensing. They identify design and procedure improvements; they set priorities for inspection and maintenance; they support changes to allowed outage times and surveillance intervals; they inform the categorisation of components by safety significance; they evaluate the significance of events and inspection findings; and they support emergency planning. In each case the decision is risk-informed: probabilistic results are weighed together with deterministic requirements, defence in depth, safety margins and performance monitoring.
In Canada, licensees use their probabilistic assessments to support decisions on design changes and operations, and the CNSC uses them in reviews and in evaluating events, alongside the deterministic safety case.
The quality of a probabilistic assessment determines how far it can be relied on. Standards and peer review define what a good assessment contains: a complete list of initiating events, realistic success criteria, careful treatment of dependencies and human actions, plant-specific data where possible, and documentation that lets a reviewer reproduce the results. A probabilistic assessment that is kept current with the plant, often called a living PSA, is far more useful than one produced once for licensing and then left on a shelf.
Scope and quality of a PSA
A complete probabilistic assessment covers all modes of operation, including low power and shutdown states, all sources of radioactive material on the site, including spent fuel pools, and all initiating events and hazards, internal and external. In practice, many assessments began with internal events at power and have been extended step by step. Shutdown states can contribute a surprising share of risk, because systems are out of service for maintenance, containment may be open and the reactor coolant system may be at reduced inventory. Spent fuel pools have long time scales, but their cooling is less redundant than that of the reactor, and their fuel is outside containment.
The quality of an assessment depends on peer review, on the data and on how well the model represents the plant as built and operated. Standards define capability categories, from a model good enough to identify the main contributors to one detailed enough to support decisions that rely on small differences in risk. Licensees keep their assessments up to date as the plant changes, as data accumulate and as methods improve. An assessment that is not maintained can give misleading results, because a modification or a change in procedure may have altered a dominant sequence.
Using PSA results
Probabilistic results are used in many ways. Configuration risk management tools, built from the plant model, show operators and maintenance planners how the risk changes when equipment is taken out of service, so that combinations that raise risk sharply are avoided. Importance measures guide inspection, testing and maintenance effort toward components that matter most. Assessments support decisions about changes to technical specifications, such as extending the allowed outage time of a diesel generator, and about design modifications. Regulators use them to judge the significance of inspection findings and events, often by estimating how much an observed degradation increased the conditional core damage probability.
Probabilistic results are never used alone. Risk-informed decision making combines them with deterministic requirements, defence in depth, safety margins and performance monitoring. A change that lowers the calculated core damage frequency but removes a level of defence or erodes a margin may still be unacceptable. This integrated approach recognises both the power of probabilistic insights and the limits of models.
Common mistakes
MistakeA core damage frequency of 10⁻⁵ per year means an accident will happen in 100 000 years.
InsteadIt is an average rate with uncertainty; it does not predict when or whether an accident will occur.
MistakeProbabilistic assessment replaces deterministic requirements.
InsteadIt complements them in risk-informed decisions.
MistakeHigh Fussell–Vesely importance means a component is unreliable.
InsteadIt means the component appears in cut sets that contribute much of the risk; the component may be reliable but critical.
Summary and key terms
- A probabilistic safety assessment estimates what can go wrong, how likely it is and what the consequences are.
- Level 1 gives core damage frequency, Level 2 release frequencies and Level 3 health and economic consequences.
- Importance measures identify which components and actions drive risk.
- Results are distributions; parameter uncertainty is propagated and model uncertainty is explored by sensitivity studies.
- Risk-informed decisions weigh probabilistic results with deterministic requirements and defence in depth.
- Probabilistic safety assessment
- A systematic estimate of accident frequencies and consequences.
- Core damage frequency
- The estimated frequency of severe core damage.
- Large release frequency
- The estimated frequency of a release above a defined size.
- Fussell–Vesely importance
- The fraction of risk from cut sets containing a basic event.
- Risk achievement worth
- The ratio of risk with a basic event assumed failed to the base risk.
- Epistemic uncertainty
- Uncertainty from incomplete knowledge of parameters and models.
Practice problems
Work each problem on paper first, then reveal the answer to check.
What does a Level 2 assessment add to Level 1?
Show answer
The containment response and the frequencies of release categories.
A basic event has RAW = 50. What does that mean?
Show answer
Risk would be 50 times higher if the event were certain, for example if the component were out of service.
Why is the mean usually used for comparison with goals?
Show answer
It reflects the whole skewed distribution, including the tail.
Name two hazards beyond internal events that a full assessment covers.
Show answer
Internal fires and seismic events, among others.
What is a living PSA?
Show answer
One kept current with the plant's design, procedures and data.
Lesson quiz · 5 questions
Score 60% or more to complete this lesson.
Create a free account to save your progress, take quizzes and earn a certificate.