
NUC-410 · Lesson 4 of 12 · 23 min
Fault trees
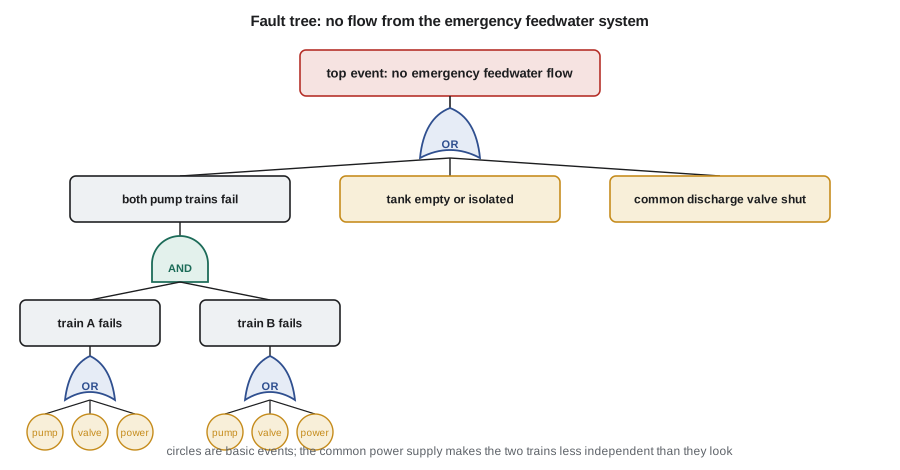
For the second half of the course Hana moves to the probabilistic team under Dr. Lise Fortin. Her first assignment is a fault tree for the emergency water supply that can feed the steam generators at Darlington if normal feedwater is lost. "A fault tree is a logical picture of how a system fails," Lise tells her. "Draw it honestly and it will show you things the system drawings hide, such as two pumps that look independent but share one power supply. Draw it carelessly and it will give you a precise number that is wrong."
What a fault tree is
A fault tree is a graphical model of the combinations of events that lead to a specified undesired outcome, called the top event. The analyst starts from the top event, such as no flow from the emergency feedwater system when demanded, and asks what immediate causes could produce it. Each cause is then broken down in turn, until the analysis reaches basic events: component failures, human errors or unavailabilities whose probabilities can be estimated from data. The logic is expressed with gates. An OR gate means the output occurs if any input occurs. An AND gate means the output occurs only if all inputs occur.
Fault trees were developed in the early 1960s for the safety analysis of missile launch control systems and were adopted by the nuclear industry in the Reactor Safety Study of 1975, often called WASH-1400, which was the first full probabilistic assessment of commercial reactors. They are now used in many industries, including aviation, chemical processing and railways. In nuclear safety they are the main tool for estimating the probability that a safety function fails on demand, which then feeds the event trees described in lesson 5.
Building a fault tree
Building a good fault tree begins with defining the top event precisely: what counts as failure, over what mission time and under what conditions. No emergency feedwater flow could mean no flow at all, flow below the minimum needed to remove decay heat, or flow that stops before the steam generators can be cooled by other means. The analyst then defines the system boundary, which equipment and support systems are included, and the success criterion, for example one of two pumps delivering flow to at least two of four steam generators.
From there the tree is developed downward one level at a time. At each step the analyst asks for the immediate, necessary and sufficient causes of the event above. Support systems such as electrical power, instrument air, cooling water and actuation signals are included because their failure can disable the front-line equipment. Test and maintenance unavailability is included because a train may be out of service when the demand comes. Human errors are included, both pre-initiator errors such as leaving a valve closed after maintenance and post-initiator errors such as failing to start a pump manually.
| Symbol | Name | Meaning |
|---|---|---|
| circle | basic event | a failure with its own probability, at the limit of resolution |
| rectangle | intermediate event | an event developed further by a gate below |
| OR gate | any input | the output occurs if at least one input occurs |
| AND gate | all inputs | the output occurs only if all inputs occur |
| house | house event | a switch set to true or false to model a configuration |
| triangle | transfer | continues the tree on another page or in a shared subtree |
Boolean algebra and minimal cut sets
A fault tree is a Boolean expression. Each gate combines its inputs with AND or OR, and the top event can be written as a single expression in the basic events. A cut set is any set of basic events whose joint occurrence causes the top event. A minimal cut set is a cut set that cannot be reduced: remove any one event and the top event no longer follows. The top event equals the OR of all the minimal cut sets. Minimal cut sets are the most useful output of fault tree analysis, because they list every way the system can fail in the simplest terms.
Finding the minimal cut sets requires expanding the expression and applying the laws of Boolean algebra. Two laws do most of the work. Idempotence says that A AND A equals A, so a shared event appearing under both branches of an AND gate collapses to a single event. Absorption says that A OR (A AND B) equals A, so a larger cut set that contains a smaller one is removed. In the feedwater example, expanding train A AND train B gives nine combinations. The combination power AND power reduces to power alone, a single event that defeats both trains, and absorption removes every other combination that contains power.
Here P, V and E stand for the pump, valve and power basic events, and the products are AND combinations. The single-event cut set E is the shared power supply. Order matters too: a cut set with one event is a first-order cut set, a single failure that defeats the system. A well-designed safety system should have no first-order cut sets except for passive failures of very low probability, and the fault tree is how designers check this.
Quantification
Once the minimal cut sets are known, the top event probability can be estimated. The probability of a cut set is the product of the probabilities of its basic events, if they are independent. The rare-event approximation adds the cut set probabilities, which slightly overestimates the true value but is accurate when the probabilities are small. The min-cut upper bound gives a closer estimate by treating the cut sets as independent and combining them as one minus the product of their complements.
# Top event probability from minimal cut sets: rare-event approximation
# and the min-cut upper bound (MCUB).
import itertools
p = {"pumpA": 3e-3, "valveA": 1e-3, "pumpB": 3e-3, "valveB": 1e-3,
     "power": 5e-4, "tank": 1e-5, "common_valve": 2e-5}
# Top = (train A fails AND train B fails) OR tank OR common valve
# train X fails = pumpX OR valveX OR power (shared power supply)
trainA = [{"pumpA"}, {"valveA"}, {"power"}]
trainB = [{"pumpB"}, {"valveB"}, {"power"}]
cuts = []
for a, b in itertools.product(trainA, trainB):
    cuts.append(frozenset(a | b))
cuts += [frozenset({"tank"}), frozenset({"common_valve"})]
# remove non-minimal cut sets
mcs = [c for c in set(cuts) if not any(o < c for o in set(cuts))]
def prob(c):
    r = 1.0
    for e in c: r *= p[e]
    return r
mcs.sort(key=prob, reverse=True)
for c in mcs: print(f"{' AND '.join(sorted(c)):24s} {prob(c):.2e}")
rare = sum(prob(c) for c in mcs)
mcub = 1.0
for c in mcs: mcub *= (1 - prob(c))
print(f"rare-event approximation {rare:.3e}")
print(f"min-cut upper bound {1 - mcub:.3e}")power 5.00e-04 common_valve 2.00e-05 tank 1.00e-05 pumpA AND pumpB 9.00e-06 pumpB AND valveA 3.00e-06 pumpA AND valveB 3.00e-06 valveA AND valveB 1.00e-06 rare-event approximation 5.460e-04 min-cut upper bound 5.460e-04
The program finds seven minimal cut sets. The shared power supply dominates at 5 × 10⁻⁴, ten times more than the next largest. Without the shared supply, the system unavailability would be about 4.6 × 10⁻⁵. The two approximations agree to three digits because the probabilities are small. This is the most common result of a real fault tree analysis: a single dependency, invisible in the system diagram, contributes most of the failure probability. The fix in this case is to supply the two trains from different electrical divisions, or to add a diverse turbine-driven pump that needs no electrical power.
Worked problem
A two-out-of-three system
A system has three pumps; any two are needed. Each pump fails on demand with probability 0.01, independently. What is the system failure probability?
Show solution
- The system fails if two or more pumps fail. Minimal cut sets: {1,2}, {1,3}, {2,3}.
- Each cut set has probability 0.01 × 0.01 = 1 × 10⁻⁴.
- Rare-event approximation: 3 × 10⁻⁴. The exact value is 3p²(1 − p) + p³ ≈ 2.98 × 10⁻⁴.
Answer: About 3 × 10⁻⁴. The approximation is good because p is small.
Data for basic events
Basic event probabilities come from several sources. Failure rates for active components such as pumps, valves and diesel generators are taken from generic databases built from many plants' operating experience and refined with plant-specific data using Bayesian updating. A failure probability on demand applies to components that must change state, such as a pump starting; a failure rate per hour applies to components that must keep running for a mission time. For a component that is tested periodically and may fail undetected between tests, the average unavailability is about half the failure rate times the test interval.
Canadian utilities use generic data sources together with station-specific experience collected through their equipment reliability programs, and share data through the CANDU Owners Group.
Common-cause failures
The calculation above assumed that the basic events are independent. Redundant trains of identical equipment are often not independent in practice: they share a design, a manufacturer, a maintenance crew, a procedure and an environment. A design error, a wrong lubricant, a mis-set relay or a harsh environment can fail several of them together. These are common-cause failures, and they usually dominate the failure probability of highly redundant systems. Ignoring them can make a four-train system look ten thousand times more reliable than it is.
Common-cause failures are modelled with parametric models. The simplest, the beta-factor model, assumes that a fraction beta of each component's failures are common-cause events that fail all redundant components at once. Typical beta values for pumps and diesel generators lie between about one and ten percent. More refined models, such as the alpha-factor model, distinguish failures of two, three or more components. Defences against common-cause failure include diversity, separation, staggered testing and maintenance by different crews, and careful review of operating experience for early signs.
Worked problem
Beta-factor estimate
Two diesel generators each fail to start with probability 0.01. With β = 0.05, estimate the probability that both fail.
Show solution
- Independent part: ((1 − β) × 0.01)² ≈ (0.0095)² ≈ 9 × 10⁻⁵.
- Common-cause part: β × 0.01 = 5 × 10⁻⁴.
- Total ≈ 5.9 × 10⁻⁴.
Answer: The common-cause term is about five times the independent term and controls the result.
Strengths and limits
Fault trees force the analyst to understand a system completely, including its support systems and dependencies, and they produce a quantitative estimate that can be compared with alternatives. Their main limits are completeness and data. A fault tree cannot contain a failure mode the analyst did not think of, and its results are only as good as the probabilities assigned to basic events. They also handle time-dependent behaviour and complex human actions poorly. For these reasons fault trees are always combined with engineering judgement, operating experience and sensitivity studies.
Building a fault tree in practice
A practical fault tree begins with a clear definition of the top event and the success criteria: for example, the failure of auxiliary feedwater to deliver at least one pump's worth of flow to at least one steam generator within thirty minutes. The analyst then works down through the system, using drawings, procedures and walk-downs, and asks at each level what could cause the failure. Boundaries must be defined so that support systems, such as electrical power, cooling water and actuation signals, are modelled once and linked consistently into every system that depends on them. Shared support systems are one of the main sources of dependence between apparently redundant trains, and fault trees reveal them explicitly.
Each basic event is given a failure mode, such as fails to start, fails to run, or is unavailable because of maintenance, and a probability or rate from plant-specific or generic data. Human failure events, such as failing to restore a valve after a test, are included as basic events too. The completed tree is reviewed by system engineers and operators, who often find failure paths that the analyst missed or modelled incorrectly. A fault tree is therefore both a calculation and a structured way of understanding how a system can fail.
Fault trees can also be used qualitatively, without any numbers at all. The list of minimal cut sets, sorted by order, shows immediately whether any single failure can defeat the system, which would violate the single failure criterion, and which pairs of failures do so. A first-order cut set involving a shared support system, such as a common cooling water header or a single actuation signal, is a design weakness that should be removed whatever its probability. Qualitative review of cut sets is therefore a valuable design tool even at an early stage, when data are uncertain.
Common mistakes
MistakeA larger fault tree is always more accurate.
InsteadAccuracy depends on correct logic, complete failure modes and good data, not size.
MistakeRedundant trains multiply reliability without limit.
InsteadCommon-cause failures limit the benefit of identical redundancy.
MistakeThe rare-event approximation underestimates risk.
InsteadIt slightly overestimates the top event probability, so it is conservative.
Summary and key terms
- A fault tree models the combinations of basic events that lead to a top event, using AND and OR gates.
- Minimal cut sets list the simplest combinations that cause the top event.
- The rare-event approximation sums cut set probabilities; the min-cut upper bound is slightly closer.
- Shared support systems and common-cause failures often dominate results.
- Data come from generic and plant-specific experience, combined by Bayesian updating.
- Top event
- The undesired outcome at the top of a fault tree.
- Basic event
- A failure at the limit of resolution, with its own probability.
- Minimal cut set
- A smallest combination of basic events that causes the top event.
- Rare-event approximation
- Summing cut set probabilities to estimate the top event probability.
- Common-cause failure
- A failure of several components from a shared cause.
- Beta factor
- The fraction of a component's failures assumed to fail all redundant components together.
Practice problems
Work each problem on paper first, then reveal the answer to check.
What does an AND gate represent?
Show answer
An output that occurs only if all inputs occur.
What is a first-order cut set?
Show answer
A single basic event that alone causes the top event.
A standby pump has λ = 1 × 10⁻⁵ per hour and is tested every 720 h. Estimate its average unavailability.
Show answer
λT/2 = 3.6 × 10⁻³.
Why does a shared power supply matter in a two-train system?
Show answer
It is a first-order cut set that defeats both trains.
Name two defences against common-cause failure.
Show answer
Diversity and separation; staggered testing and different maintenance crews.
Lesson quiz · 5 questions
Score 60% or more to complete this lesson.
Create a free account to save your progress, take quizzes and earn a certificate.