
MBA-611 · Lesson 2 of 12 · 22 min
Trade theory and why countries trade
Dr. Tan starts the second session with two labels from the cohort's own clothing. Owen's fleece was made in Bangladesh; Leo's shirt in Vietnam. She asks why a jacket designed in Toronto should be sewn eleven thousand kilometres away and shipped across the Pacific, when there are skilled sewers much closer. Owen suggests that wages are lower in Asia. Hana points out that Canada and the United States still make some of the most expensive outdoor gear in the world. Dr. Tan says that both answers are partly right, and that the theories of trade developed over the past two and a half centuries explain why. Managers rarely cite these theories by name, but they rely on them whenever they decide where to make, buy or sell something.
From mercantilism to absolute advantage
For much of the seventeenth and eighteenth centuries, European governments followed mercantilism, the view that a nation grows rich by exporting more than it imports and accumulating gold and silver. Mercantilist policy meant tariffs on imports, subsidies for exports and colonies that supplied raw materials and bought finished goods. The idea has never quite disappeared: politicians still describe trade deficits as losses and surpluses as victories, as though trade were a contest that one side wins.
Adam Smith challenged this view in The Wealth of Nations in 1776. He argued that a country gains from trade when it specializes in what it can produce more efficiently than others, its absolute advantage, and buys the rest. If Scotland can make wool more cheaply than France and France can make wine more cheaply than Scotland, both are better off if each specializes and trades. The wealth of a nation, in Smith's view, lies in the goods and services its people can consume, not in the gold it stores.
Comparative advantage
Smith's argument left an awkward question. What if one country is more efficient at producing everything? David Ricardo answered it in 1817 with the principle of comparative advantage, which economists still regard as one of the most important and least intuitive ideas in their field. Even a country that is less efficient at everything gains by specializing in the goods it produces at the lowest opportunity cost, that is, the goods for which it gives up the least of other goods, and trading for the rest. What matters is not absolute efficiency but relative efficiency.
Dr. Tan works through a modern version. Suppose that in Canada it takes 2 hours of labour to make a jacket and 4 hours to make a machined part, while in Vietnam it takes 3 hours to make a jacket and 12 hours to make a part. Canada is more efficient at both. But the opportunity cost of a part in Canada is 2 jackets, while in Vietnam it is 4 jackets; and the opportunity cost of a jacket in Canada is half a part, while in Vietnam it is only a quarter of a part. Canada has a comparative advantage in parts and Vietnam in jackets. If each specializes and they trade at any rate between 2 and 4 jackets per part, both can consume more than they could alone.
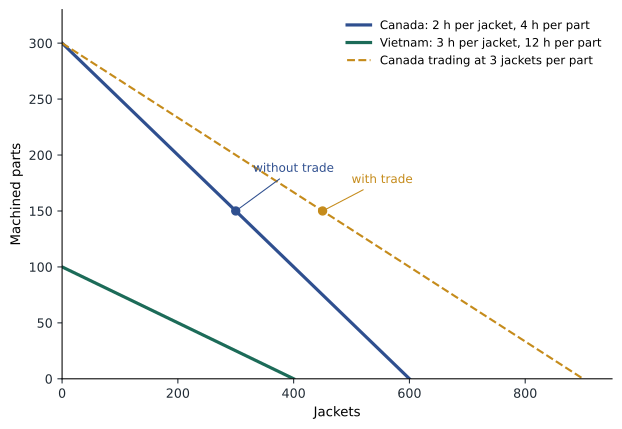
# Comparative advantage: hours of work per unit and gains from specialization
hours = {"Canada": {"jacket": 2, "part": 4}, "Vietnam": {"jacket": 3, "part": 12}}
avail = {"Canada": 1200, "Vietnam": 3600}          # hours available in each country

for c, h in hours.items():
    print(f"{c}: a part costs {h['part'] / h['jacket']:.1f} jackets; a jacket costs {h['jacket'] / h['part']:.2f} parts")

# Without trade: each country splits its hours equally between the two goods
auto = {c: {g: avail[c] / 2 / h[g] for g in h} for c, h in hours.items()}
# With trade: Canada makes only parts, Vietnam only jackets
spec = {"Canada": {"jacket": 0, "part": avail["Canada"] / 4},
        "Vietnam": {"jacket": avail["Vietnam"] / 3, "part": 0}}
price = 3            # jackets per part, between the opportunity costs of 2 and 4
canada_sells = 150   # parts sent to Vietnam
cons = {"Canada": {"jacket": canada_sells * price, "part": spec["Canada"]["part"] - canada_sells},
        "Vietnam": {"jacket": spec["Vietnam"]["jacket"] - canada_sells * price, "part": canada_sells}}
for c in hours:
    a, t = auto[c], cons[c]
print(f"{c:<8} no trade: {a['jacket']:.0f} jackets, {a['part']:.0f} parts | with trade: {t['jacket']:.0f} jackets, {t['part']:.0f} parts")Canada: a part costs 2.0 jackets; a jacket costs 0.50 parts Vietnam: a part costs 4.0 jackets; a jacket costs 0.25 parts Canada no trade: 300 jackets, 150 parts | with trade: 450 jackets, 150 parts Vietnam no trade: 600 jackets, 150 parts | with trade: 750 jackets, 150 parts
In the example, both countries end up with more jackets and at least as many parts as they had without trade. The gains come from reallocating labour to where its relative productivity is highest. The exact split depends on the price at which they trade: a price closer to 2 jackets per part gives more of the gains to Vietnam, a price closer to 4 gives more to Canada.
Comparative advantage explains why rich countries with high wages still export, and why poor countries with low productivity can still sell to rich ones. It also explains why high wages are not, by themselves, a disadvantage: wages are high where productivity is high, and what matters for trade is productivity relative to wages in each industry. The cohort notes a practical consequence. When Cedarline moved production from China to Vietnam and Bangladesh over the past decade, it was following shifts in comparative advantage as Chinese wages rose faster than Chinese productivity in sewing, which remains labour-intensive and hard to automate.
Factor endowments and who wins and loses
In the early twentieth century, the Swedish economists Eli Heckscher and Bertil Ohlin offered an explanation for where comparative advantage comes from. Countries differ in their endowments of factors of production: land, labour, capital and, in later versions, skills and natural resources. A country tends to export goods that use its abundant factors intensively and import goods that use its scarce factors. Canada, with abundant land, forests, minerals and energy, exports wheat, lumber, metals and oil; Bangladesh, with abundant labour, exports clothing. The United States, with abundant capital and highly educated workers, exports aircraft, software and financial services.
The theory has a sharp implication, worked out by Wolfgang Stolper and Paul Samuelson in 1941: trade raises the returns to a country's abundant factors and lowers the returns to its scarce ones. In a rich country, opening to trade with labour-abundant countries tends to benefit owners of capital and skilled workers and to hurt less-skilled workers in import-competing industries. This is why trade creates winners and losers within each country even when the country as a whole gains. Research by David Autor, David Dorn and Gordon Hanson on what they called the China shock found that American regions most exposed to Chinese import competition after 2000 suffered lasting losses in manufacturing jobs and wages, and that workers did not move or retrain as quickly as earlier theory assumed.
Not every test of the theory has gone smoothly. In 1953 Wassily Leontief found that American exports were, surprisingly, less capital-intensive than American imports, a result known as the Leontief paradox. Later work resolved much of the puzzle by recognizing that American exports were intensive in skilled labour and technology, which are forms of capital that Leontief's data did not capture. The lesson for managers is that a country's advantages lie in the skills, institutions and knowledge it has built up, not just in its raw endowments.
Scale, variety and firms
Classical theories explain trade between dissimilar countries: Canada sells lumber to Japan and buys cars. But much of world trade is between similar rich countries exchanging similar goods. Canada and the United States each export cars to the other; Germany and France each sell the other machinery and food. This intra-industry trade puzzled economists until Paul Krugman, in work published around 1979 and 1980 for which he later received the Nobel Prize, showed that economies of scale and consumers' taste for variety can explain it. When production has large fixed costs, each country specializes in particular varieties and sells them in a larger, combined market, and consumers gain access to more varieties at lower prices.
Marc Melitz added a further insight in 2003. Within any industry, firms differ widely in productivity, and only the most productive can cover the extra costs of selling abroad: finding distributors, adapting products, meeting foreign rules and shipping across borders. When trade opens, the most productive firms expand into export markets, the least productive shrink or exit, and the industry's average productivity rises. Evidence from many countries confirms that exporters are a small minority of firms but account for most exports, and that they are larger, more productive and pay higher wages than non-exporters. For Cedarline, this research is both encouraging and sobering: exporting can make a strong firm stronger, but only firms that can bear the fixed costs of entering a market succeed abroad.
Global value chains and trade in tasks
Since the 1990s, much trade has been in parts and services rather than finished goods. A jacket's value chain might include design and marketing in Toronto, membrane fabric from Taiwan, insulation from the United States, zippers from Japan, sewing in Vietnam, ocean shipping by a Danish carrier and retail at home. Each country specializes in tasks rather than whole products, according to its comparative advantage in each stage. Economists measure trade in value added to show where value is actually created: much of the value of an imported jacket is the design, brand and retail margin captured at home, not the sewing captured in Vietnam.
The smile curve, an idea popularized in the 1990s by the founder of the Taiwanese computer company Acer, describes the distribution of value along such chains. Value added is highest at the two ends, in research, design and branding at the start and in marketing, distribution and service at the end, and lowest in the middle, in manufacturing and assembly. Companies and countries try to move up the curve toward the ends. For managers, the curve is a reminder that the location of production is only one choice in a value chain; the stages a firm keeps in-house and where it locates them matter more for profit.
Distance still matters: the gravity model
One of the most reliable regularities in economics is the gravity model of trade, first estimated by Jan Tinbergen in 1962. Trade between two countries is roughly proportional to the product of their economic sizes and inversely proportional to the distance between them. Larger economies trade more, and nearby economies trade more. Later research added other forms of distance: a shared language, a common border, colonial ties, a trade agreement or a common currency each raise trade substantially, while differences in legal systems lower it.
# Gravity model: predicted trade for an exporter of output 2.3 (trillions) with several partners
import math
Y_home = 2.3
partners = {   # output (trillions of US dollars), distance (thousand km), shared language or border
    "United States": (30.5, 1.0, True), "Mexico": (1.9, 3.3, False), "United Kingdom": (3.8, 5.6, True),
    "Germany": (4.7, 6.4, False), "Japan": (4.2, 10.3, False), "Vietnam": (0.5, 13.0, False)}
G = 1.0
bonus = 1.6     # trade multiplier for a shared language or border, a typical estimate
pred = {}
for name, (Y, D, link) in partners.items():
    pred[name] = G * Y_home * Y / D * (bonus if link else 1.0)
total = sum(pred.values())
for name, v in sorted(pred.items(), key=lambda kv: -kv[1]):
print(f"{name:<15} predicted share of trade with these partners: {v / total:6.1%}")United States predicted share of trade with these partners: 94.5% United Kingdom predicted share of trade with these partners: 2.1% Germany predicted share of trade with these partners: 1.4% Mexico predicted share of trade with these partners: 1.1% Japan predicted share of trade with these partners: 0.8% Vietnam predicted share of trade with these partners: 0.1%
The illustrative model predicts that most of the trade of an economy the size of Canada's would be with the United States, and very little with distant Vietnam, simply because the United States is large and close. That prediction is even more concentrated than Canada's actual pattern, in which about three-quarters of goods exports go to the United States, but it captures the strong pull of a large neighbour. Distance in the gravity model stands for many costs: transport, time, the difficulty of communication, and differences in tastes and rules. Dr. Tan tells the cohort that the model has a sobering message for any plan to diversify away from the nearest large market: geography and size create a strong pull, and policy can bend it only gradually.
National competitive advantage
Michael Porter's The Competitive Advantage of Nations, published in 1990, asked why particular countries are home to world-leading firms in particular industries: Italy in tiles and fashion, Switzerland in pharmaceuticals and watches, Denmark in wind turbines. His answer was the diamond, four connected sets of conditions. Factor conditions include specialized skills and infrastructure, often created rather than inherited. Demand conditions include sophisticated, demanding home customers who push firms to improve. Related and supporting industries supply inputs and ideas. And firm strategy, structure and rivalry, especially intense local competition, drive innovation. Porter argued that these conditions concentrate in clusters, such as the outdoor gear firms around Vancouver and in Quebec, where suppliers, skilled workers and demanding customers reinforce one another.
For Cedarline, the diamond explains why its strength at home may travel. Canadian winters and outdoor culture create demanding customers for technical apparel, and the cluster of designers and testers around its head office is a source of advantage. Whether those advantages work abroad depends on whether foreign customers value what Cedarline's home customers taught it to do well.
Worked problem
Who has the comparative advantage?
In Country A, a worker can make 10 sweaters or 5 tents in a day; in Country B, a worker can make 6 sweaters or 1 tent. Which country has a comparative advantage in each good, and within what range must the price of a tent, in sweaters, lie for both to gain from trade?
Show solution
- Opportunity cost of a tent in A: 10 / 5 = 2 sweaters. In B: 6 / 1 = 6 sweaters.
- Opportunity cost of a sweater in A: 5 / 10 = 0.5 tents. In B: 1 / 6 ≈ 0.17 tents.
- A has the lower opportunity cost for tents, so it has the comparative advantage in tents; B has the comparative advantage in sweaters, though A is more productive at both.
- Both gain if a tent trades for more than 2 sweaters (so A gains by exporting tents) and fewer than 6 (so B gains by buying them).
Answer: A should specialize in tents and B in sweaters, trading at a price between 2 and 6 sweaters per tent. Absolute productivity does not decide the pattern; relative productivity does.
Common mistakes
MistakeA country that is less efficient at everything cannot gain from trade.
InsteadIt gains by specializing where its opportunity cost is lowest; comparative, not absolute, advantage decides.
MistakeTrade benefits everyone in each country.
InsteadThe country gains overall, but owners of scarce factors and workers in import-competing industries can lose, as the China shock showed.
MistakeHigh wages make a country uncompetitive.
InsteadWages are high where productivity is high; what matters is productivity relative to wages in each industry.
MistakeThe location of manufacturing determines where value is created.
InsteadMuch value is captured in design, branding, distribution and service; trade in value added and the smile curve show this.
Summary and key terms
- Mercantilism treated trade as a contest; Smith showed that specialization by absolute advantage benefits both sides.
- Ricardo's comparative advantage shows that countries gain by specializing where their opportunity cost is lowest.
- Heckscher–Ohlin links trade to factor endowments; Stolper–Samuelson shows that trade creates winners and losers within countries.
- Krugman's new trade theory explains intra-industry trade through scale and variety; Melitz showed that only the most productive firms export.
- Global value chains split products into tasks; most value is often captured in design and distribution rather than assembly.
- The gravity model shows that size and distance still shape trade; Porter's diamond explains national clusters of strong firms.
- Comparative advantage
- The ability to produce a good at a lower opportunity cost than another country.
- Opportunity cost
- The amount of another good that must be given up to produce one more unit of a good.
- Factor endowments
- A country's relative supplies of land, labour, capital, skills and resources.
- Intra-industry trade
- Two-way trade in similar goods between similar countries.
- Global value chain
- The division of a product's production into stages located in different countries.
- Gravity model
- A model in which trade rises with the economic size of two countries and falls with distance between them.
Practice problems
Work each problem on paper first, then reveal the answer to check.
In Country X a worker makes 8 shirts or 4 radios a day; in Country Y, 9 shirts or 3 radios. Who has the comparative advantage in radios?
Show answer
Opportunity cost of a radio: X 2 shirts, Y 3 shirts. X has the comparative advantage in radios; Y in shirts.
Why does Stolper–Samuelson help explain political opposition to trade agreements in rich countries?
Show answer
Trade with labour-abundant countries lowers returns to less-skilled labour in rich countries, so workers in import-competing industries can lose even though the country gains.
Explain why Canada and the United States trade cars in both directions.
Show answer
Economies of scale and consumers' taste for variety lead each country's plants to specialize in particular models and sell them across the combined market.
According to the gravity model, what happens to predicted trade if the distance between two countries doubles, all else equal?
Show answer
It roughly halves, in the simple form of the model with distance entering with an exponent of one.
Lesson quiz · 5 questions
Score 60% or more to complete this lesson.
Create a free account to save your progress, take quizzes and earn a certificate.