
LES-102 · Lesson 2 of 12 · 21 min
Measuring crime: police statistics, victim surveys and the dark figure
▶ Video coming soon A video version of this lesson is on the way.
Linh Tran arrives at the second class with a printout from the Port Ardent crime analyst's office and a puzzle. The city's police-recorded break-ins fell by 9% last year, but in the community survey the service ran, more residents said they had been victims of a break-in than the year before. Which number is true? Professor Desjardins says both may be, and that the gap between them is one of the oldest problems in criminology. Every measure of crime captures some of it and misses some of it. A good analyst knows what each source can and cannot show, and never treats a single number as the whole truth.
The crime funnel and the dark figure
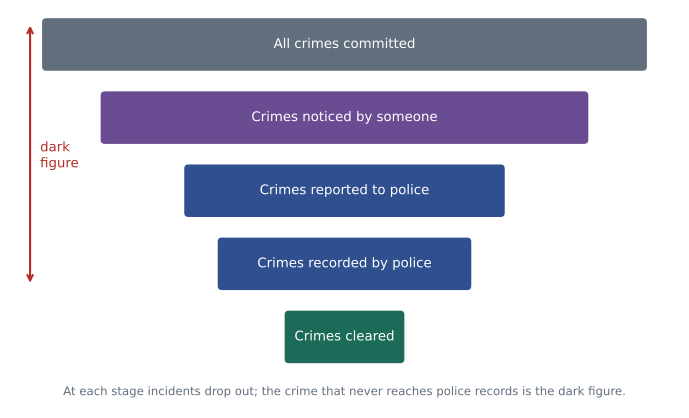
For a crime to appear in police statistics, a long chain of events has to occur. Someone has to notice that a crime happened, which is not always obvious: many frauds and thefts go undetected. Someone, usually the victim, has to decide to tell the police. The police have to record the report as a crime, which requires them to accept that an offence occurred and classify it. Only then does it enter the statistics. At each link some incidents drop out. The crime that never enters official statistics is called the dark figure of crime, a phrase that goes back to nineteenth-century European statisticians.
The size of the dark figure varies enormously by offence. Almost every homicide becomes known to police, because a body is hard to hide and the death must be explained. Most motor vehicle thefts are reported, because insurers require a police report. At the other extreme, the great majority of sexual assaults, much shoplifting, most minor assaults between acquaintances and a large share of online fraud never reach police. Victims stay silent because they think the incident was too minor, they believe police could do nothing, they fear the offender or the process, they handled it another way, or they distrust the police. For some groups, including many Indigenous, Black and newcomer communities, distrust is a significant reason.
Police-reported statistics
Canada's main source of police-reported crime data is the Uniform Crime Reporting Survey, run by the Canadian Centre for Justice and Community Safety Statistics at Statistics Canada. Since 1962 every police service has reported the crimes it records, and the incident-based version of the survey, known as UCR2, collects details on each incident, including the type of offence, the characteristics of victims and accused persons, weapons and whether the incident was cleared. Statistics Canada publishes national, provincial and city results every July.
Police data have real strengths. They are collected continuously, cover the whole country, include details on accused persons and outcomes, and can be broken down to small areas such as neighbourhoods and street segments, which is essential for police deployment. Their weaknesses follow from the funnel. They count only what is reported and recorded. They can change because of police activity rather than crime: a crackdown on impaired driving or drug dealing produces more recorded offences, because these crimes are mostly discovered by police rather than reported by victims. Changes in recording rules or computer systems can create jumps that have nothing to do with behaviour.
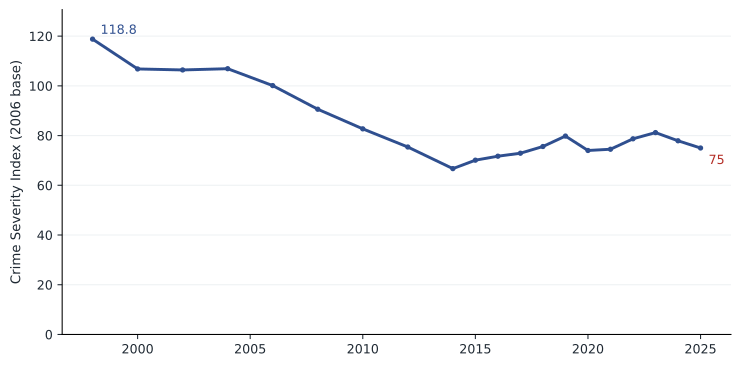
The traditional crime rate has another problem: it counts every offence equally, so a rise in minor thefts can outweigh a fall in homicides. To address this, Statistics Canada introduced the Crime Severity Index in 2009. Each offence is weighted by the average sentence courts impose for it, so serious crimes count far more than minor ones. The index is set to 100 for the base year of 2006. In 2025 the national Crime Severity Index was 75.0, down 4.9% from the year before, and the violent Crime Severity Index was 97.2. The police-reported crime rate was 5,585 incidents per 100,000 people, down 2.4%, and police recorded 672 homicides, a rate of 1.61 per 100,000 and the lowest in years.
Victimization surveys
Victimization surveys ask a random sample of people whether they have been victims of crime in a recent period, whether they reported it and why or why not. Because they ask victims directly, they capture crime that never reached police, and they allow researchers to estimate the dark figure. Statistics Canada's General Social Survey on Canadians' Safety, conducted every five years, found that only about 29% of violent and household victimization incidents in 2019 were reported to police. The Survey of Safety in Public and Private Spaces, repeated in 2025, found that about 5.8% of people aged 15 and older had been physically or sexually assaulted in the previous year, and that only 8.6% of sexual assault victims reported the most serious incident to police, compared with 28% of physical assault victims.
Victimization surveys have their own weaknesses. They depend on people remembering incidents accurately and placing them in the right time period. Respondents may not recognize an incident as a crime, or may not wish to disclose it, especially if the offender is a family member. Surveys cannot ask homicide victims, and they usually exclude young children, people in institutions and people experiencing homelessness, some of whom face very high risks. They do not cover crimes without an individual victim, such as drug trafficking, and they are expensive, so samples are often too small to give reliable figures for individual cities or neighbourhoods. Finally, a survey result is an estimate with a margin of error.
Self-report studies
A third method asks people about crimes they have committed. Self-report studies, usually anonymous questionnaires given to students or young adults, began in the 1940s and 1950s. They produced a surprising finding: most young people admit to some offending, such as minor theft, fighting, vandalism or underage drinking, but only a small share are ever caught. Offending was far more widespread across social classes than police records suggested, while serious and frequent offending was concentrated in a much smaller group. Self-report data also allow researchers to study the causes of offending, because the same survey can ask about family, school, friends and attitudes.
Self-report surveys work best for common, less serious offences and for groups that can be surveyed easily, such as students. The most serious and frequent offenders may be absent from school on survey day, may refuse to answer or may exaggerate or minimize. Researchers check validity by comparing answers with official records, and generally find that self-reports are reasonably accurate for most respondents, although accuracy varies across groups and offences.
| Source | Captures well | Misses or distorts |
|---|---|---|
| Police-reported statistics | Serious crimes, all areas, small-area detail, accused persons and case outcomes | Unreported crime; changes caused by police activity or recording rules |
| Victimization surveys | Unreported crime against individuals and households; reasons for not reporting | Homicide, crimes without individual victims, small areas; memory errors |
| Self-report studies | Common offending and its causes; offending never detected | The most serious and frequent offenders; honesty and memory |
Estimating the dark figure
If we know how many incidents of a type police recorded and what share of such incidents victims report, we can estimate how many actually occurred. The estimate is rough: it assumes that the survey's reporting rate applies locally and that police record every incident reported to them. Linh uses the reporting rates from Port Ardent's 2024 community survey, which asked 1,200 residents about their experiences, together with police counts for 2025. The code below estimates the true number of incidents and the share of each type that never reaches police records.
# Estimating the dark figure: recorded incidents divided by the share reported
recorded = {"break-ins": 470, "motor vehicle theft": 260, "theft": 1840,
            "assault": 880, "sexual assault": 95, "fraud": 610}
reported_share = {"break-ins": 0.50, "motor vehicle theft": 0.85, "theft": 0.32,
                  "assault": 0.38, "sexual assault": 0.09, "fraud": 0.20}
total_rec = total_est = 0
for kind in recorded:
    est = recorded[kind] / reported_share[kind]
    total_rec += recorded[kind]; total_est += est
    print(f"{kind:20s} recorded {recorded[kind]:5d}  estimated {est:7.0f}  unrecorded {1 - recorded[kind] / est:5.0%}")
print(f"all six types: recorded {total_rec}, estimated {total_est:,.0f}, recorded share {total_rec / total_est:.0%}")break-ins recorded 470 estimated 940 unrecorded 50% motor vehicle theft recorded 260 estimated 306 unrecorded 15% theft recorded 1840 estimated 5750 unrecorded 68% assault recorded 880 estimated 2316 unrecorded 62% sexual assault recorded 95 estimated 1056 unrecorded 91% fraud recorded 610 estimated 3050 unrecorded 80% all six types: recorded 4155, estimated 13,417, recorded share 31%
The estimates show why police data alone mislead. Vehicle theft is mostly reported, so police records come close to the true count. Sexual assault is mostly unreported, so the roughly 95 recorded incidents probably represent more than 1,000. Across these six offence types, police records capture only about three in ten incidents. Linh notes a second implication: a change in the reporting rate can move police statistics even if the true amount of crime stays the same. When a police service makes it easier to report sexual assault, or when public attitudes change, recorded sexual assaults may rise while actual victimization stays level or falls.
Other sources of crime data
Analysts increasingly combine the three classic sources with others. Calls for service show what the public asks police to deal with, including disorder and incidents never recorded as crimes. Hospital emergency department records capture assault injuries that victims did not report to police; a well-known program in Cardiff, Wales, shared anonymous hospital data on where and when assaults happened with police and licensing officials, and violent injuries fell compared with similar cities. Insurance claims, retail loss surveys and bank fraud records show property and financial crime that rarely reaches police, which Priya knows well from her years at the bank. Court and corrections data show what happens after charges are laid. Each source has its own gaps, but where several point the same way an analyst can be far more confident.
Data on people accused of crime need particular care. Police-reported data on accused persons describe only incidents where someone was identified, which is a minority of property crimes. They also reflect where police look. If one neighbourhood is patrolled far more heavily than another, more of its residents will be stopped and charged for offences, such as drug possession, that are equally common elsewhere. This is why criminologists check patterns in accused-person data against victimization and self-report data before drawing conclusions about who offends.
Reading crime statistics with care
Professor Desjardins gives the class five rules for reading any crime statistic. First, ask what source it comes from and what that source can capture. Second, prefer rates to counts when comparing places or years, because populations change. Third, look at trends over several years rather than a single year's change, since small numbers bounce around: a city that goes from 4 homicides to 6 has not had a 50% crime wave. Fourth, check whether definitions or recording practices changed. Fifth, look at more than one source; when police data and victimization surveys move in the same direction, the conclusion is much stronger.
These rules resolve Linh's puzzle. Police-recorded break-ins fell 9%, but the survey suggested a rise. The survey sample was small, so its estimate had a wide margin of error. At the same time, Port Ardent had launched an online reporting system for minor property crime in 2024, and some residents who reported online were not counted in the break-in category because the system filed them as thefts. The apparent contradiction came partly from chance and partly from a change in recording. Linh's recommendation to the analyst is to check how online reports were classified before anyone draws conclusions about break-ins.
Small numbers deserve special care. If a neighbourhood averages 10 robberies a year, chance alone will produce years with 6 and years with 15. A useful rule of thumb for counts of rare events is that random variation is roughly the square root of the average, so a count of about 10 can easily vary by 3 or more either way without any real change. Analysts compare a year's count with this expected range before declaring a trend. The same applies to clearance rates and to rates for small groups, where one or two incidents can swing a rate dramatically.
Worked problem
Is it a crime wave?
A local news site reports that robberies in Port Ardent's downtown zone rose from 9 in 2024 to 14 in 2025, a 56% increase, and calls it a crime wave. The zone averaged 11 robberies a year over the previous five years. How should Linh assess the claim?
Show solution
- Compare with the long-run average rather than only the previous year: 14 against an average of 11.
- Estimate random variation: the square root of 11 is about 3.3, so counts from about 8 to 14 are within normal year-to-year variation.
- Check the previous year: 9 was below average, so part of the increase is a return toward normal.
- Look for other evidence: did victim reports, calls for service or robberies in neighbouring zones also rise? Did any recording practice change?
Answer: A count of 14 is at the upper edge of normal variation around an average of 11, and the jump from 9 is partly a return to the usual level. The claim of a crime wave is not supported by these numbers alone. Linh would watch the next few months and check related data, and would describe the change as an increase worth monitoring rather than a wave.
Common mistakes
MistakePolice statistics show how much crime there is.
InsteadPolice statistics show crime that was reported and recorded. Victimization surveys show that much crime, especially sexual assault and minor theft, never reaches police.
MistakeA rise in recorded crime always means more crime.
InsteadRecorded crime can rise because of more reporting, more police activity or new recording practices, even if actual crime is flat.
MistakeA 50% increase is always significant.
InsteadWith small counts, large relative changes are common by chance. Compare with the long-run average and the expected random variation.
MistakeVictimization surveys are perfect because they ask victims directly.
InsteadSurveys miss homicide, victimless crimes and hard-to-reach groups, depend on memory and disclosure, and carry margins of error.
Summary and key terms
- The dark figure of crime is the crime that never enters official statistics, because it is not noticed, not reported or not recorded.
- Police-reported data come from the UCR Survey; the Crime Severity Index weights offences by seriousness.
- Victimization data come from the General Social Survey and the Survey of Safety in Public and Private Spaces.
- Self-report studies show that minor offending is widespread while serious offending is concentrated in a small group.
- Dividing recorded incidents by the share reported gives a rough estimate of the true number of incidents.
- Use rates, multi-year trends, more than one source and awareness of chance variation when interpreting crime statistics.
- Dark figure of crime
- Crime that is never reported to or recorded by police.
- Victimization survey
- A survey asking a random sample of people about crimes they experienced, whether or not they reported them.
- Self-report study
- A survey asking people, usually anonymously, about offences they have committed.
- Crime Severity Index
- A Statistics Canada measure that weights each offence by its seriousness, based on average sentences.
- NIBRS
- The National Incident-Based Reporting System, the FBI's detailed system for recording each crime incident.
- Reporting rate
- The share of incidents of a type that victims or witnesses report to police.
Practice problems
Work each problem on paper first, then reveal the answer to check.
Why are almost all homicides known to police, while most sexual assaults are not?
Show answer
A death must be investigated and is hard to conceal; sexual assault victims often do not report because of fear, shame, distrust or a belief nothing will be done.
Police recorded 120 frauds and the survey suggests 25% of frauds are reported. Estimate the true number.
Show answer
120 / 0.25 = 480 frauds.
Give one strength and one weakness of self-report studies.
Show answer
Strength: they capture undetected offending and its causes. Weakness: the most serious offenders may be missing or answer inaccurately.
A park recorded 4 assaults one year and 7 the next. Is that a crime wave?
Show answer
Not necessarily; with an average of about 5, chance variation of 2 or more either way is expected.
Lesson quiz · 5 questions
Score 60% or more to complete this lesson.
Create a free account to save your progress, take quizzes and earn a certificate.