
ITIL-150 · Lesson 5 of 12 · 21 min
Platforms, observability and AIOps
As Larchmont creates more product teams, a new problem appears. Each team needs environments, pipelines, monitoring, security scanning, databases and cloud accounts. If every team builds these for itself, effort is duplicated, standards drift and specialists are spread thin. If a central team builds them on request, it becomes a queue that slows everyone down. Platforms are the answer many organizations have reached: shared, self-service capabilities that product teams consume like a product.
This lesson covers platform engineering, site reliability engineering (SRE) and error budgets, observability, and AIOps, the use of analytics and machine learning to manage events and incidents. These are the operational foundations that make fast, safe change possible, and they connect directly to the ITIL practices of monitoring and event management, incident management, problem management, capacity and performance management and infrastructure and platform management.
Platforms as products
A platform is a set of shared capabilities, such as compute, data, pipelines, observability, identity and security tooling, offered to internal teams through self-service interfaces and documentation. An internal developer platform lets a product team create a new service with a pipeline, monitoring, logging and security checks already wired in, often in minutes, by following a 'golden path': a supported, well-documented way of doing common things.
The key idea of platform engineering is to treat the platform as a product whose customers are internal teams. The platform team does discovery with those teams, measures adoption and satisfaction, publishes a roadmap and makes the golden path the easiest path rather than a mandate. Teams may leave the golden path when they have good reason, but they then take on more of the work and risk themselves.
| Capability | Self-service offering | Larchmont example |
|---|---|---|
| Environments | Create a new service with standard infrastructure as code | Template for a containerized API with staging and production |
| Pipelines | Standard pipeline with tests, scans and progressive release | Shared pipeline used by all product teams |
| Observability | Logs, metrics, traces and dashboards configured automatically | Every new service gets a default dashboard and alerts |
| Data | Managed databases, backups and data catalogue | Approved database types with automatic backups |
| Security | Secrets management, scanning, identity integration | Single sign-on and secrets vault wired in by default |
Platforms change the shape of several ITIL practices. Infrastructure and platform management becomes product management for the platform. Service configuration management becomes more automated, because infrastructure defined as code is self-describing. Capacity management becomes a platform feature, with autoscaling and cost dashboards. The platform team still runs services and has its own SLOs, incidents and changes.
Site reliability engineering and error budgets
Site reliability engineering is an approach to operations that began at Google in the early 2000s and was popularized by books published from 2016 onward. SRE treats operations as a software problem: reliability is engineered, toil is measured and reduced (often with a cap on how much of an engineer's time it may consume), and decisions about reliability are made with data.
Central to SRE are service level indicators and objectives, which ITIL-141 introduced, and the error budget. If the objective is that 99.9 % of booking requests succeed within two seconds over 30 days, then 0.1 % of requests may fail or be slow: that is the error budget. While budget remains, the team can release features freely. If the budget is spent, the team slows feature work and focuses on reliability until performance recovers. The error budget turns an argument about speed versus stability into a shared, data-based rule.
Worked problem
Error budget and burn rate
Larchmont Connect's booking API serves about 3.6 million requests in 30 days with an SLO of 99.9 % good requests. In the first 6 days of the month, 2,100 requests failed. How much of the error budget is used, and at this rate will the budget last the month?
Show solution
- Error budget = 0.1 % x 3,600,000 = 3,600 bad requests for the month.
- Used so far = 2,100 / 3,600 = 58 % of the budget in 6 days (20 % of the month).
- Burn rate = 58 % / 20 % = 2.9 times the sustainable rate.
- At this rate the budget runs out after about 6 / 0.58 = 10.3 days.
Answer: 58 % of the budget is gone after 20 % of the month, a burn rate of about 2.9. The budget will be exhausted around day 10, so the team should pause risky releases and fix the cause now.
# Multi-window burn-rate alert check for an SLO (illustrative thresholds)
slo = 0.999
budget = 1 - slo
windows = {  # window: (bad requests, total requests)
    "1 hour":  (95, 5_200),
    "6 hours": (310, 31_000),
    "3 days":  (1_150, 360_000),
}
for name, (bad, total) in windows.items():
    err = bad / total
    burn = err / budget
    print(f"{name:>8}: error rate {err * 100:.3f} %, burn rate {burn:5.1f}")

fast = windows["1 hour"][0] / windows["1 hour"][1] / budget
slow = windows["6 hours"][0] / windows["6 hours"][1] / budget
if fast > 14.4 and slow > 6:
    print("page the on-call engineer: budget burning very fast")
elif slow > 6 or windows["3 days"][0] / windows["3 days"][1] / budget > 1:
    print("open a ticket: budget burning faster than sustainable")
else:
print("no action")1 hour: error rate 1.827 %, burn rate 18.3 6 hours: error rate 1.000 %, burn rate 10.0 3 days: error rate 0.319 %, burn rate 3.2 page the on-call engineer: budget burning very fast
Burn-rate alerting, widely described in SRE literature, alerts on how fast the budget is being consumed over more than one window rather than on every error. It reduces noise: a brief spike that does not threaten the objective creates no page, while a sustained problem does. The thresholds above are illustrative; teams tune them to their own objectives and tolerance.
Observability
Monitoring answers questions you thought of in advance: is the server up, is the queue longer than 1,000 messages? Observability is the ability to understand what is happening inside a system from the data it produces, including questions nobody anticipated. It relies on three main kinds of telemetry: metrics (numbers over time, such as request rates and latency), logs (records of events) and traces (the path of a single request through many services). Many teams also use profiles and real-user monitoring of what customers actually experience in browsers and apps.
Modern digital products are made of many services, so a single customer action, such as booking a load, may touch the app, an API gateway, the booking service, pricing, carrier capacity, a mapping API and the payment provider. Distributed tracing shows where the time goes and where errors arise. OpenTelemetry, an open-source project under the Cloud Native Computing Foundation, has become a common standard for producing this telemetry so that organizations are not locked into one vendor.
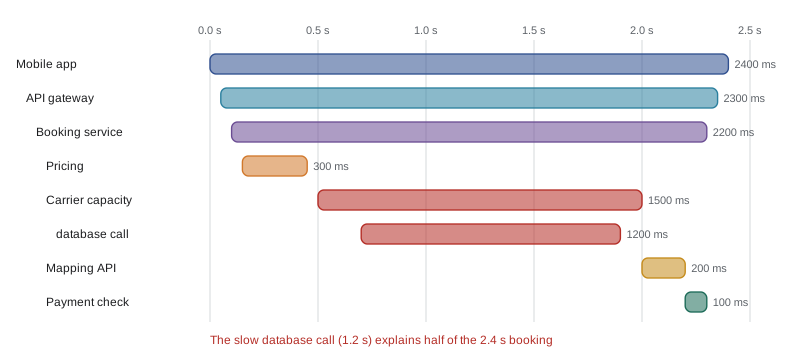
Larchmont's baseline showed that only 41 % of incidents were detected by monitoring before users noticed. After the platform team wired default observability into every new service and added real-user monitoring to the app, that figure rose to 63 % within six months. The biggest gains came from monitoring user journeys ('can a test customer complete a booking?') rather than individual servers.
Telemetry often contains personal information: customer names in logs, IP addresses, account numbers in traces. Under PIPEDA and provincial laws, Larchmont must limit collection to what is needed, protect it and keep it only as long as necessary. Practical steps include masking personal data at source, setting log retention periods, restricting access and checking where an observability vendor stores data, since some Canadian public bodies and contracts require data to stay in Canada.
Monitoring and event management
ITIL's monitoring and event management practice systematically observes services and components and records and reports selected changes of state, identified as events. Events are classified as informational, warning or exception. In a modern stack the volume is enormous: Larchmont's systems generate over two million events a day. Without filtering and correlation, staff drown in alerts, start ignoring them and miss the ones that matter, a condition often called alert fatigue.
Good event management defines which events matter, sets thresholds based on user impact, deduplicates repeats, correlates related events into a single incident, enriches alerts with context (recent changes, affected services, runbooks) and routes them to the right team. Every alert that pages a person should be actionable; if the right response is 'ignore it', the alert should be removed or downgraded.
AIOps
AIOps, a term coined by the analyst firm Gartner around 2016, means applying big data and machine learning to IT operations. Typical capabilities include noise reduction (deduplicating and correlating events), anomaly detection (spotting unusual patterns without fixed thresholds), probable root-cause suggestions (linking symptoms to recent changes or failing components), forecasting (predicting capacity exhaustion or certificate expiry) and automated remediation for known issues.
| AIOps capability | What it does | Example | Risk |
|---|---|---|---|
| Correlation | Groups related events into one incident | 400 alerts from one switch failure become 1 incident | Wrongly merges unrelated problems |
| Anomaly detection | Flags unusual behaviour against learned baselines | Bookings drop 40 % for one customer segment at 10 a.m. | False alarms during legitimate changes, such as holidays |
| Change correlation | Links incidents to recent changes | Latency rose 4 minutes after a pricing deployment | Coincidence mistaken for cause |
| Forecasting | Predicts future capacity or failures | Database storage full in 19 days at current growth | Trends break when the business changes |
| Automated remediation | Runs known fixes automatically | Restart a hung integration worker and open a problem record | Hides recurring problems if not reviewed |
AIOps works best on top of good foundations: clean configuration data so that events can be related to services, consistent telemetry, and well-defined runbooks for automated actions. Organizations that buy AIOps tools to compensate for poor monitoring and configuration management are usually disappointed. Larchmont's experience was typical: correlation cut alert volume by about 70 % once service maps from the CMDB were accurate, but produced confusing groupings before that.
Because AIOps uses machine learning, it also raises the governance questions covered in lessons 8 and 9: how accurate is it, how do we know when it is wrong, who is accountable for automated actions and how do humans stay in control? An AIOps engine that automatically restarts services is making operational changes, so it falls within change enablement and needs the same discipline as any other automation.
Bringing it together
Platforms, SRE, observability and AIOps reinforce each other. The platform makes good observability the default; observability provides the data for SLOs and error budgets; error budgets guide how fast teams release; AIOps reduces noise and speeds diagnosis when things go wrong; and lessons from incidents feed back into the platform's golden paths. Service management provides the practices that hold this together: incident, problem, change, capacity, configuration and continual improvement, performed with far more automation than before.
Platforms, capacity and cost
Platforms make it easy to create resources, which also makes it easy to waste money. Cloud bills at Larchmont rose 31 % in the first six months of the platform, mostly from test environments left running and oversized databases. The platform team responded with practices often grouped under the name FinOps: tagging every resource with its owning team and product, showing each team its own costs on a dashboard, setting budgets with alerts, shutting down non-production environments outside working hours by default, and reviewing the largest cost items monthly with product owners.
Capacity and performance management changes shape in the same way. Instead of forecasting server purchases a year ahead, the platform provides autoscaling within limits, and product teams set performance objectives and watch cost per transaction. The capacity practice still matters, especially for shared components that cannot scale instantly, such as the warehouse database and network links to distribution centres, and for month-end and seasonal peaks when many services grow at once.
| Measure | Before platform | After 9 months |
|---|---|---|
| Time to create a new service with pipeline and monitoring | 3-4 weeks | Under 1 day |
| Share of services with default dashboards and alerts | 35 % | 88 % |
| Monthly cloud cost per 1,000 bookings | $412 | $365 after FinOps changes |
| Non-production environments running overnight | 100 % | 22 % |
Common mistakes
MistakeBuilding a platform as a mandatory central system without asking product teams what they need.
InsteadTreat the platform as a product: do discovery, measure adoption and make the golden path the easiest path.
MistakeAlerting on every error.
InsteadAlert on user impact and error budget burn rates so that every page is actionable.
MistakeMonitoring only servers and components.
InsteadMonitor user journeys and real-user experience as well.
MistakeBuying AIOps to fix poor monitoring and configuration data.
InsteadFix the foundations first; AIOps amplifies good data and confuses bad data.
MistakeLogging everything forever.
InsteadMask personal data, set retention periods and restrict access to telemetry.
Summary and key terms
- Platforms provide shared self-service capabilities and golden paths; platform engineering treats the platform as a product for internal teams.
- SRE engineers reliability, limits toil and uses SLOs and error budgets to balance feature speed against reliability.
- Burn-rate alerting pages people when the error budget is being consumed too fast, reducing noise.
- Observability uses metrics, logs and traces to understand systems, including unanticipated questions; monitoring user journeys is especially valuable.
- Monitoring and event management must filter, correlate and enrich events to prevent alert fatigue.
- AIOps applies analytics and machine learning to operations but depends on good data and needs governance like any automation.
- Platform engineering
- Building and running shared self-service capabilities for internal teams, managed as a product.
- Golden path
- A supported, documented and easy way to do a common task on a platform.
- Error budget
- The amount of unreliability allowed by an SLO over a period.
- Observability
- The ability to understand a system's internal state from the telemetry it produces.
- AIOps
- The use of big data analytics and machine learning to support IT operations.
Practice problems
Work each problem on paper first, then reveal the answer to check.
What makes a platform a "product" in platform engineering?
Show answer
It has internal customers, does discovery, measures adoption and satisfaction, has a roadmap and makes the supported path the easiest.
An SLO is 99.5 % over 30 days for 2 million requests. What is the error budget?
Show answer
0.5 % x 2,000,000 = 10,000 bad requests.
What does a burn rate of 1 mean?
Show answer
The error budget is being consumed at exactly the rate that would use it all by the end of the period.
Name the three main kinds of telemetry.
Show answer
Metrics, logs and traces.
Why did Larchmont's event correlation work poorly at first?
Show answer
Service maps in the CMDB were inaccurate, so the tool could not relate events to services correctly.
Why does automated remediation fall within change enablement?
Show answer
Because it makes operational changes, which need control, records and review like any other change.
Lesson quiz · 5 questions
Score 60% or more to complete this lesson.
Create a free account to save your progress, take quizzes and earn a certificate.