
ITIL-150 · Lesson 12 of 12 · 21 min
Measuring transformation and the capstone roadmap
Larchmont's three-year plan began in lesson 1 with a baseline and a set of targets. A year later, the board asks the obvious questions: is it working, is it worth the money, and what should change? This final lesson covers how to measure a transformation honestly, how to combine measures of delivery, experience, operations, AI governance and people into a coherent picture, how to avoid the traps that make measurement misleading, and how to turn findings into the next stage of the roadmap. It ends with a capstone that pulls the whole course together.
Why transformation measurement is hard
Transformations are long, involve many changes at once and play out in a business that keeps moving. Benefits often lag effort by months. Some benefits, such as reduced risk or better culture, are hard to quantify. Several initiatives may affect the same outcome, so attributing results is difficult. And people have incentives to report progress, which can tilt measures toward activity ('teams trained', 'tools deployed') rather than results.
Good measurement responds with a clear chain from strategy to measures, a mix of leading and lagging indicators, honest baselines, regular review and a willingness to act on bad news. It also accepts that some judgments will be qualitative and says so rather than inventing false precision.
From goals to measures
The goal-question-metric (GQM) approach, developed in software engineering in the 1980s, is a simple discipline: state the goal, ask the questions that would show whether it is being achieved, and only then choose metrics that answer those questions. It prevents the common mistake of measuring whatever data is easy to collect. OKRs, introduced in ITIL-120, follow a similar logic, with objectives stating intent and key results measuring progress.
| Goal | Question | Metric |
|---|---|---|
| Customers prefer to do business with us digitally | Are customers choosing digital channels and succeeding? | Online booking share; booking completion rate; digital CSAT |
| We deliver change quickly and safely | Is flow faster without hurting stability? | Lead time; deployment frequency; change failure rate; recovery time |
| Our services are reliable and well run | Do we find and fix problems before users notice? | Incidents detected by monitoring; SLO attainment; repeat incidents |
| We use AI responsibly | Is every AI system known, assessed and monitored? | Share of registered systems with current assessments; AI incidents; monitoring alerts closed on time |
| Our people can thrive in the new model | Do staff have the skills, tools and safety to work well? | Staff positive about tools; skills coverage; Westrum score; turnover |
Leading indicators show whether the conditions for success are in place and move early: platform adoption, automation coverage, skills coverage, share of AI systems assessed. Lagging indicators show results and move later: online booking share, customer satisfaction, cost per booking. A transformation dashboard needs both, because lagging indicators alone arrive too late to steer and leading indicators alone can show activity without results.
Flow and value measures
Many digital organizations measure flow across whole value streams, not just within teams. Flow time is the total time from when work is accepted to when it delivers value to the customer. Flow efficiency is the share of that time when the work is actively being worked on rather than waiting; ITIL-130 introduced it in value stream mapping. Flow load is the amount of work in progress, and flow velocity the amount completed per period. Little's law links these: average flow time equals average work in progress divided by average throughput, so reducing work in progress shortens flow time.
Worked problem
Using Little's law
The warehouse product team has on average 36 items in progress and completes 12 items a week. What is the average flow time? If the team caps work in progress at 18 items while keeping throughput at 12 a week, what happens?
Show solution
- Average flow time = WIP / throughput = 36 / 12 = 3 weeks.
- With a cap of 18: flow time = 18 / 12 = 1.5 weeks.
- Throughput is unchanged, but each item reaches customers twice as fast.
- Lower WIP also usually reduces context switching, which can raise throughput further.
Answer: Flow time falls from 3 weeks to 1.5 weeks. Limiting work in progress is one of the cheapest ways to speed up delivery.
Value measures connect flow to the business. For Larchmont these include cost per booking, revenue from digital channels, customer retention and claims cost. Benefits realization, covered in PMP-150 and ITIL-130, tracks whether the benefits promised in the business case actually arrive, who owns each benefit and when it is expected.
Traps in measurement
Goodhart's law, often paraphrased as 'when a measure becomes a target, it ceases to be a good measure', warns that people will optimize the number rather than the outcome. A service desk measured on first-contact resolution may close tickets prematurely; a virtual agent measured on containment may make it hard to reach a person; a product team measured on deployment frequency may split changes artificially. Using several balanced measures, looking at the experience behind them and talking to the people doing the work reduces gaming.
| Trap | Example | Remedy |
|---|---|---|
| Vanity metrics | "12,000 app downloads" | Measure active use and outcomes, such as repeat bookings |
| Activity over outcome | "300 staff trained in AI" | Measure whether practice changed, such as fewer AI policy breaches and better reviews |
| Single-number targets | Containment rate as the bot's only target | Balance with resolution, effort and errors |
| Watermelon reporting | Green milestones, red experience | Include experience and outcome measures |
| False precision | Culture improvement of "23.7 %" | Report ranges, sample sizes and qualitative evidence |
| Attribution claims | "The virtual agent cut costs by $2 million" | Use control groups or trends, and acknowledge other causes |
Larchmont after year one
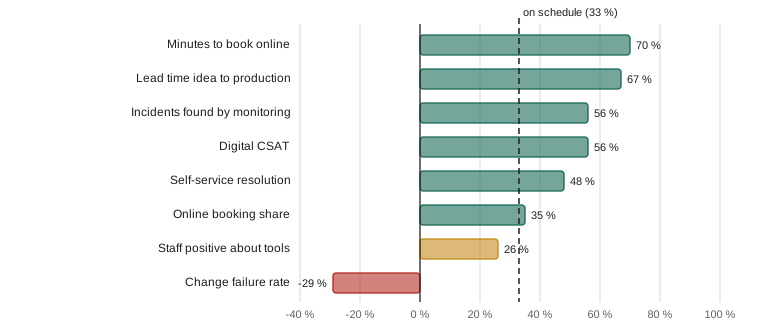
One year in, LTS compiled results against the baseline and three-year targets. Some measures moved fast, some slowly, and one went the wrong way. The progress index below shows how much of the gap from baseline to target has been closed for each measure.
# Year-one progress toward three-year targets (invented results)
measures = [
    # name, baseline, year 1, target
    ("online booking share %",          38,  51,  75),
    ("minutes to book online",           14,   7,   4),
    ("lead time idea to prod (days)",    74,  31,  10),
    ("self-service resolution %",         9,  24,  40),
    ("incidents found by monitoring %",  41,  63,  80),
    ("digital CSAT (1-5)",              3.1, 3.6, 4.0),
    ("staff positive about tools %",     52,  58,  75),
    ("change failure rate %",            17,  19,  10),
]
print(f"{'measure':<34}{'base':>6}{'yr1':>6}{'target':>8}{'gap closed':>12}")
for name, b, y, t in measures:
    closed = (y - b) / (t - b) * 100
    note = "  <- moving the wrong way" if closed < 0 else ""
    print(f"{name:<34}{b:>6}{y:>6}{t:>8}{closed:>11.0f} %{note}")
avg = sum((y - b) / (t - b) for _, b, y, t in measures) / len(measures) * 100
print(f"average gap closed after one of three years: {avg:.0f} %")measure base yr1 target gap closed online booking share % 38 51 75 35 % minutes to book online 14 7 4 70 % lead time idea to prod (days) 74 31 10 67 % self-service resolution % 9 24 40 48 % incidents found by monitoring % 41 63 80 56 % digital CSAT (1-5) 3.1 3.6 4.0 56 % staff positive about tools % 52 58 75 26 % change failure rate % 17 19 10 -29 % <- moving the wrong way average gap closed after one of three years: 41 %
The picture is encouraging but uneven. Booking time, lead time and incident detection have closed half or more of their gaps in a third of the time. Self-service and online share are close to schedule. Staff experience lags, consistent with the culture survey in lesson 11 and with the extra load of change. The change failure rate has worsened slightly as deployment frequency rose, which matches the early DORA data in lesson 4: speed has outpaced investment in testing and progressive release.
Reviewing and adapting the roadmap
Measurement is only useful if it changes decisions. Larchmont's steering group held a year-one review structured around three questions: what is working and should be scaled, what is not working and why, and what should change in the roadmap. It used the guiding principles from lesson 10 as a check and invited product teams, the service desk and two customers to present their views.
The review led to four decisions. First, wave two would include a stability push: every product team would spend a quarter improving automated tests and progressive release, with an explicit goal of bringing change failure rate below 13 % before increasing deployment frequency further. Second, staff experience would get a named executive owner and a funded program fixing the ten most complained-about internal tools. Third, the virtual agent would expand from tracking to proof-of-delivery and contact changes only after its true resolution rate passed 60 %. Fourth, the résumé screening feature would be permanently switched off, since the vendor could not explain its scoring.
Measuring a digital transformation increasingly includes its environmental footprint, as data centres, cloud services and AI models consume energy. In Canada, the Canadian Sustainability Standards Board issued its first sustainability disclosure standards (CSDS 1 and 2) in December 2024 for voluntary use, and regulators have been considering whether to require climate disclosure; the federal government also publishes greening government commitments for its own operations. Larchmont added cloud energy use and emissions estimates from its providers to the transformation dashboard so that AI and platform growth would be visible in its sustainability reporting.
Capstone: Larchmont's years two and three
The capstone brings together every lesson. Imagine you are advising Larchmont's steering group on the plan for years two and three. A strong plan would include the following elements, each traceable to an earlier lesson.
| Area | Recommendation | Lesson |
|---|---|---|
| Products | Create product teams for warehouse operations and transport planning; retire the 2019 portal in waves with archived history | 1, 2 |
| Experience | Add XLAs for booking and support; blueprint the claims journey next; meet accessibility standards in all customer channels | 3 |
| Delivery | Stability quarter, then extend automated change authorization; target change failure rate under 10 % | 4 |
| Operations | Make observability and SLOs default for all services; expand burn-rate alerting; tune AIOps correlation after CMDB clean-up | 5 |
| AI use | Scale agent assist; expand the virtual agent by scope only when true resolution passes thresholds; pilot change risk prediction with human review | 6, 7 |
| AI governance | Keep the inventory complete including embedded AI; impact assessments for every high-risk system; quarterly board reporting; consider ISO/IEC 42001 readiness | 8, 9 |
| Organization | Finish the team topology; keep central major incident, security, supplier and portfolio functions; publish the practice ownership matrix | 10 |
| People | Fund the staff experience program; continue AI literacy and the automation academy; cap change load per team | 11 |
| Measurement | Quarterly reviews of the full dashboard with leading and lagging indicators; benefits owners for each business case benefit | 12 |
A plan like this is not a fixed blueprint. It is the current best hypothesis, to be tested and revised at each review. That is perhaps the most important idea of the whole course: digital products, automation, AI and transformation all reward organizations that learn quickly from evidence, and punish those that commit to a plan and stop looking.
Preparing for advanced ITIL assessments
Advanced ITIL assessments on products, experience, strategy, AI governance and transformation tend to present scenarios and ask which action best applies the framework. Useful habits are to identify the outcome the scenario is really about, look for answers that focus on value and experience rather than activity, prefer iterative and evidence-based approaches over big-bang ones, check that the answer considers people, technology, suppliers and processes, and for AI questions look for accountability, transparency, human oversight and lifecycle risk management. Confirm the format, edition and rules of your specific exam with the exam provider before you book.
Common mistakes
MistakeMeasuring what is easy rather than what matters.
InsteadUse goal-question-metric to choose measures that answer real questions.
MistakeRelying only on lagging indicators.
InsteadCombine leading indicators that steer with lagging indicators that confirm results.
MistakeSetting single-number targets.
InsteadBalance measures to reduce gaming, as Goodhart's law warns.
MistakeReporting transformation progress as milestones only.
InsteadReport gap closed against baseline and target, including measures moving the wrong way.
MistakeTreating the roadmap as fixed.
InsteadReview it regularly and change it based on evidence.
Summary and key terms
- Transformation measurement is hard because benefits lag, attribution is difficult and incentives favour reporting activity.
- Goal-question-metric and OKRs link strategy to meaningful measures; dashboards need both leading and lagging indicators.
- Flow measures and Little's law show how limiting work in progress shortens flow time; value measures and benefits realization connect flow to the business.
- Goodhart's law, vanity metrics, watermelon reporting, false precision and attribution claims are common traps.
- Progress should be reported as gap closed from baseline to target, including measures moving the wrong way.
- Measurement must drive decisions; the roadmap is a hypothesis to be tested and revised.
- Goal-question-metric (GQM)
- An approach that chooses metrics by first stating goals and the questions that show progress toward them.
- Leading indicator
- A measure that moves early and shows whether conditions for success are in place.
- Lagging indicator
- A measure that shows results after they have happened.
- Little's law
- Average flow time equals average work in progress divided by average throughput.
- Goodhart's law
- The tendency of a measure to stop reflecting the underlying goal once it becomes a target.
Practice problems
Work each problem on paper first, then reveal the answer to check.
Classify as leading or lagging: platform adoption; online booking share; skills coverage; customer satisfaction.
Show answer
Platform adoption and skills coverage are leading; online booking share and customer satisfaction are lagging.
A team has 40 items in progress and completes 10 a week. What is the average flow time?
Show answer
40 / 10 = 4 weeks.
Baseline 20 %, target 60 %, current 35 %. What share of the gap is closed?
Show answer
(35 - 20) / (60 - 20) = 37.5 %.
Give an example of Goodhart's law in service management.
Show answer
A virtual agent targeted only on containment makes it hard to reach a person, raising containment while hurting experience.
Why did Larchmont plan a stability quarter in wave two?
Show answer
Change failure rate worsened as deployment frequency rose, showing speed had outpaced testing and progressive release.
Why is the roadmap described as a hypothesis?
Show answer
Because it should be tested against evidence and revised at each review rather than followed rigidly.
Lesson quiz · 5 questions
Score 60% or more to complete this lesson.
Create a free account to save your progress, take quizzes and earn a certificate.