
ITIL-140 · Lesson 4 of 12 · 32 min
Incident management II: resolution, major incidents and swarming
Lesson 3 took an incident from detection to a clear priority. This lesson follows it to resolution. It covers escalation, diagnosis and resolution, closure, the special handling of major incidents, and the shift from rigid tiers toward swarming. It also measures incident performance with mean time to restore service, mean time between failures and availability, and explains where incident management meets information security and the legal duty to report breaches.
Escalation
When the service desk cannot resolve an incident, it escalates. ITIL traditionally distinguishes two kinds. Functional escalation passes the incident to a team with more specialized skills or access, such as the network team or an application support group. Hierarchical escalation informs or involves more senior managers, usually because the incident is serious, a target is at risk or a decision is needed that the current team cannot make, such as approving overtime or invoking a supplier's premium support.
Escalation rules should be explicit. Typical triggers are a time limit at the service desk (for example, escalate if not resolved within 15 minutes for P2 and above), a need for skills or access the desk lacks, or a target that is about to be breached. Clear ownership is just as important: the incident should have one owner, often the service desk, who stays accountable for coordination and communication even while specialists do the technical work. Incidents that bounce between teams with nobody owning them are a classic failure.
| Escalation type | Purpose | Example trigger |
|---|---|---|
| Functional | Bring in specialist skills or access | Database error the service desk cannot diagnose |
| Hierarchical | Involve managers for authority, resources or awareness | P1 incident; resolution target at risk; supplier not responding |
| Supplier | Engage an external provider under contract | Fault in a cloud service or vendor-supported product |
Diagnosis and resolution
Diagnosis means finding out enough about what is wrong to restore service. It does not necessarily mean finding the root cause, which is problem management's job. Resolvers gather information from monitoring, logs, recent changes and the configuration management system; reproduce the symptoms where possible; and test hypotheses one at a time. Good diagnosis is methodical. Changing several things at once may restore service but leaves nobody sure what worked, which makes the next occurrence harder.
Resolution restores service. It may be a permanent fix, but often it is a workaround: restarting a service, failing over to a standby system, rolling back a recent change or giving users an alternative way to work. ITIL is clear that a workaround which restores service is a successful resolution of the incident, even if the underlying cause remains. Recovery then confirms that service is fully back: data synchronized, queues cleared and dependent services working.
Worked problem
Restore first, investigate later
An online booking site starts failing after a 14:00 release. At 14:20 the team identifies two options: roll back the release, which takes 10 minutes and restores the previous version; or diagnose the code defect, which might take two hours. What should incident management do?
Show solution
- The incident management goal is to minimize impact by restoring service quickly.
- Rollback restores service at about 14:30; diagnosis-first might leave customers unable to book until 16:30 or later.
- Roll back, confirm bookings work, then raise a problem so the defect is analysed and fixed before the release is attempted again.
Answer: Roll back now and pass the cause to problem management. The incident is resolved when booking works again.
Closure
Closure confirms that the user is satisfied and the record is complete. Many organizations resolve an incident first and close it a few days later if the user does not object, which avoids reopening a closed record when the fix does not hold. At closure, the resolver records the actual cause category, the resolution, whether a workaround was used, and whether a problem record should be raised. A short satisfaction survey may be sent. Closure data feeds problem management, knowledge management and continual improvement, so quality matters.
Measuring incident performance
Several measures describe how incident management is performing. Mean time to restore service (MTTR, sometimes called mean time to repair or recover) is the average time from detection to restoration. Mean time between failures (MTBF) is the average time a service runs between incidents. Availability is the share of agreed service time during which the service is usable. A standard relationship links them for a repairable service: availability equals MTBF divided by the sum of MTBF and MTTR.
The formula shows two ways to improve availability: fail less often (raise MTBF, mostly the work of problem management, design and change) or recover faster (lower MTTR, mostly the work of incident management, monitoring and knowledge). Incident management's distinctive contribution is the second.
Worked problem
Availability from MTBF and MTTR
A service fails on average once every 720 hours and takes an average of 2 hours to restore. What is its availability? If better runbooks cut MTTR to 30 minutes, what does availability become?
Show solution
- Current: 720 ÷ (720 + 2) = 720 ÷ 722 ≈ 99.72 %.
- Improved: 720 ÷ (720 + 0.5) = 720 ÷ 720.5 ≈ 99.93 %.
- Over a year of 8,760 hours, downtime falls from about 24.3 hours to about 6.1 hours.
Answer: Availability rises from about 99.72 % to about 99.93 % without any reduction in failures.
Averages can hide a great deal. A mean of 2 hours might come from most incidents taking 30 minutes and a few taking 20 hours. Percentiles, such as the time within which 90 % of incidents are restored, often describe the user experience better. The program below generates a synthetic month of incidents with a seeded random generator, computes MTTR, MTBF, availability and percentiles, and shows how much a few long incidents affect the mean.
import random, statistics

random.seed(140)
HOURS = 30 * 24                       # one 30-day month
# synthetic incidents: most restore quickly, a few take much longer (lognormal)
restore_min = [round(random.lognormvariate(3.6, 0.9)) for _ in range(18)]
restore_min.sort()

down_h = sum(restore_min) / 60
mttr_h = statistics.mean(restore_min) / 60
mtbf_h = (HOURS - down_h) / len(restore_min)
avail = mtbf_h / (mtbf_h + mttr_h)

def pct(data, p):
    k = (len(data) - 1) * p
    f, c = int(k), min(int(k) + 1, len(data) - 1)
    return data[f] + (data[c] - data[f]) * (k - f)

print("restore times (min):", restore_min)
print(f"incidents: {len(restore_min)}   total downtime: {down_h:.1f} h")
print(f"MTTR: {mttr_h*60:.0f} min   median: {statistics.median(restore_min):.0f} min   90th percentile: {pct(restore_min, 0.9):.0f} min")
print(f"MTBF: {mtbf_h:.1f} h   availability: {avail:.3%}")
print(f"check: (720 - downtime) / 720 = {(HOURS - down_h) / HOURS:.3%}")restore times (min): [8, 17, 22, 23, 27, 32, 35, 36, 37, 56, 58, 81, 84, 93, 98, 131, 264, 336] incidents: 18 total downtime: 24.0 h MTTR: 80 min median: 46 min 90th percentile: 171 min MTBF: 38.7 h availability: 96.671% check: (720 - downtime) / 720 = 96.671%
The mean restoration time sits well above the median because a handful of long incidents pull it up. Reporting both, plus a high percentile, tells service owners whether they have a general speed problem or a few incidents that need special attention. The final line confirms that the MTBF and MTTR formula gives the same availability as the simple downtime calculation when MTBF is measured as uptime per incident.
Major incidents
A major incident is an incident with significant business impact that requires a response beyond the normal process. Each organization defines its own criteria, typically a P1 on a critical service, a widespread outage, a threat to safety or a serious reputational or financial risk. Major incidents get a separate procedure because normal queues, handoffs and update intervals are too slow.
A typical major incident procedure names a major incident manager who coordinates the response and does not do the technical work; opens a bridge call or dedicated chat channel; brings the right technical teams and suppliers together at once; assigns a communications lead to update users, executives and the service desk at fixed intervals; tracks decisions and actions in a timeline; and agrees in advance who may approve emergency changes. When service is restored, the incident is not finished until a post-incident review has been held.
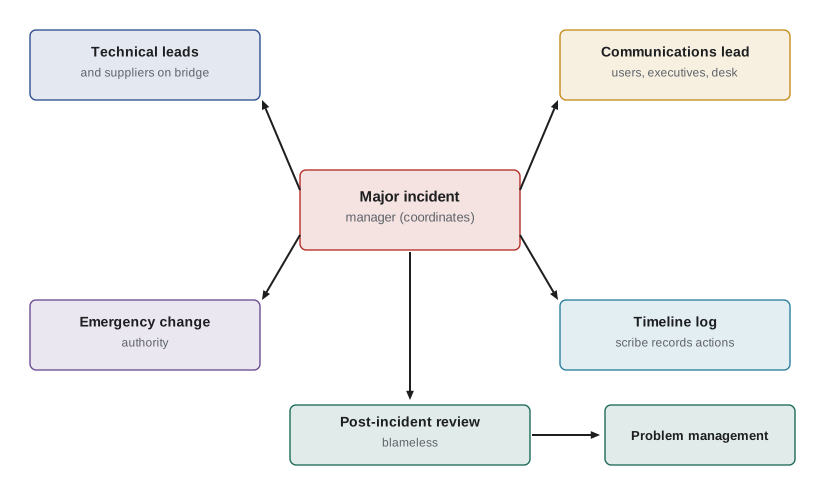
| Role | Responsibility |
|---|---|
| Major incident manager | Coordinates the response, drives decisions, keeps the timeline, declares resolution |
| Technical leads | Diagnose and restore service in their areas |
| Communications lead | Sends regular updates to users, executives, the service desk and, if needed, the public |
| Emergency change authority | Approves urgent changes needed to restore service |
| Service desk | Handles the surge of contacts, links them to the major incident, gives consistent information |
| Scribe | Records actions, decisions and times for the review |
Post-incident reviews
A post-incident review, also called a retrospective or post-mortem, examines what happened, how it was detected, how the response went and what should change. The best reviews are blameless: they assume people acted reasonably with the information they had and look for system weaknesses rather than individuals to punish. Blame drives people to hide mistakes, which destroys the information the organization needs to learn. Typical outputs are a timeline, contributing factors, what went well, what could be improved, and actions with owners and dates. Actions to remove causes go to problem management; actions to improve the response go to incident management itself.
Worked problem
Measuring a major incident timeline
A payment service fails at 09:02. Monitoring alerts at 09:06. The on-call engineer acknowledges at 09:14. A bridge is opened at 09:25. The cause is identified at 10:10 and a rollback restores service at 10:25. Calculate time to detect, time to acknowledge, time to mobilize and total time to restore.
Show solution
- Time to detect: 09:02 to 09:06 = 4 minutes.
- Time to acknowledge: 09:06 to 09:14 = 8 minutes.
- Time to mobilize the bridge: 09:14 to 09:25 = 11 minutes.
- Time to restore: 09:02 to 10:25 = 83 minutes, of which 45 minutes went on diagnosis and 15 on recovery.
Answer: Detection 4 min, acknowledgement 8 min, mobilization 11 min, restoration 83 min. The review should ask why acknowledgement and mobilization took 19 minutes before diagnosis began.
From tiers to swarming
Traditional support uses tiers. The service desk (often called tier 1 or first line) handles what it can and escalates the rest to tier 2 specialists, who escalate further to tier 3 experts or suppliers. Tiers are simple to manage but create queues and handoffs, and each handoff loses information and adds delay. Experts at higher tiers rarely see the easy cases, so knowledge does not flow back down.
Swarming is an alternative. Instead of passing an incident up a ladder, the first person who cannot resolve it pulls in the right people immediately, through a chat channel or a short meeting, and they work it together until it is resolved. Some organizations run regular swarms where experts are available at set times; others use severity-based swarms. Swarming reduces handoffs, spreads knowledge and often cuts resolution time. It also needs a culture of helpfulness, tools that make experts reachable and some protection for experts' time so they are not constantly interrupted. Many organizations combine both models: tiers for routine work, swarming for complex or high-impact incidents.
| Aspect | Tiered support | Swarming |
|---|---|---|
| Flow of work | Sequential escalation through levels | Collaborative, the right people join at once |
| Handoffs | Many | Few |
| Knowledge transfer | Slow, mostly upward | Fast, in both directions |
| Ownership | Often moves with each escalation | Stays with the person who started the swarm |
| Risks | Queues, ping-pong between teams | Interruptions for experts, unclear priorities if unmanaged |
Incident management and information security
Lesson 1 distinguished ITIL incidents from security incidents. In practice the two meet constantly. The service desk is often where users first report suspicious activity, and a ransomware attack is both a service outage and a security incident. Organizations need a clear handover: the service desk recognizes possible security events, follows a defined procedure, preserves evidence (for example by not wiping an affected laptop) and passes the case to the security team, which leads containment, eradication and recovery. Incident management continues to handle the service impact and communication with users. Mixing the two without a plan can destroy evidence or delay legal notifications.
Security incidents that involve personal information can trigger legal reporting duties. These are summarized below at a level useful for service management staff; ITIL-141 and the CISSP courses go further.
| Duty | What it requires (summary) |
|---|---|
| PIPEDA breach of security safeguards | Private-sector organizations must report breaches involving personal information that create a real risk of significant harm to the Office of the Privacy Commissioner of Canada and to affected individuals as soon as feasible, and keep records of all breaches for 24 months. |
| Quebec Law 25 | Organizations must notify the Commission d'accès à l'information and affected people promptly of confidentiality incidents that present a risk of serious injury, and keep a register of all such incidents. |
| Critical cyber systems | Bill C-8 received royal assent in June 2026. Its Critical Cyber Systems Protection Act is being phased in and will require designated operators in federally regulated sectors to report cyber security incidents to the Communications Security Establishment within set time limits. |
| Provincial public sector | Public bodies are covered by provincial and federal public-sector privacy laws, several of which now require breach notification. |
For incident management, the practical lessons are to recognize when an incident may involve personal information or a material security event, escalate to the right people quickly, record times carefully because deadlines run from discovery or determination, and avoid making public statements that have not been approved.
Common mistakes
MistakeWaiting to find the root cause before restoring service.
InsteadRestore service with a workaround or rollback, then pass the cause to problem management.
MistakeLetting incidents bounce between teams with no owner.
InsteadKeep one owner accountable for coordination and communication throughout.
MistakeAsking the major incident manager to fix the problem personally.
InsteadThe major incident manager coordinates; technical leads restore service.
MistakeRunning post-incident reviews to find someone to blame.
InsteadRun blameless reviews that find system weaknesses and assign improvement actions.
MistakeWiping a compromised laptop to restore the user quickly.
InsteadFollow the security procedure to preserve evidence and hand over to the security team.
Summary and key terms
- Functional escalation brings in specialist skills; hierarchical escalation brings in authority and awareness.
- Diagnosis aims to restore service; workarounds and rollbacks are valid resolutions.
- Closure confirms the fix and records data for problem and knowledge management.
- Availability equals MTBF ÷ (MTBF + MTTR); incident management mainly lowers MTTR.
- Report medians and percentiles as well as means, because long incidents distort averages.
- Major incidents need a separate procedure with coordination, communication and blameless reviews.
- Swarming reduces handoffs; security incidents and breach reporting need a defined handover.
- Functional escalation
- Transferring an incident to a team with more specialized skills or access.
- Hierarchical escalation
- Involving more senior managers because of severity, risk or a needed decision.
- Workaround
- A solution that reduces or eliminates the impact of an incident without removing its cause.
- Mean time to restore service (MTTR)
- The average time from detection of an incident to restoration of service.
- Mean time between failures (MTBF)
- The average time a service operates between incidents.
- Availability
- The share of agreed service time during which a service is usable.
- Major incident
- An incident with significant business impact requiring a response beyond the normal process.
- Major incident manager
- The person who coordinates the response to a major incident.
- Post-incident review
- A structured, usually blameless, review of an incident and the response to it.
- Swarming
- Bringing the right people together to work an incident collaboratively instead of escalating through tiers.
Practice problems
Work each problem on paper first, then reveal the answer to check.
What is the difference between functional and hierarchical escalation?
Show answer
Functional brings in specialist skills or access; hierarchical involves managers for authority, resources or awareness.
Is restarting a service a valid resolution if the cause is unknown?
Show answer
Yes, if it restores service; the cause goes to problem management.
MTBF is 500 hours and MTTR is 5 hours. What is availability?
Show answer
500 ÷ 505 ≈ 99.01 %.
Why report the 90th percentile of restoration time as well as the mean?
Show answer
Because a few long incidents distort the mean; percentiles show what most users experience.
Name three roles in a major incident response.
Show answer
Any three of: major incident manager, technical leads, communications lead, emergency change authority, service desk, scribe.
Why should post-incident reviews be blameless?
Show answer
Blame makes people hide information; blameless reviews surface system weaknesses that can be fixed.
A service failed at 13:00, was detected at 13:12 and restored at 14:05. What were time to detect and time to restore?
Show answer
12 minutes to detect; 65 minutes to restore.
Give one benefit and one risk of swarming.
Show answer
Benefit: fewer handoffs and faster knowledge transfer. Risk: frequent interruptions for experts.
Why should the service desk avoid wiping a laptop suspected of malware?
Show answer
It may destroy evidence the security team needs.
Under SEC rules, how long does a US public company have to disclose a material cybersecurity incident?
Show answer
Four business days after determining the incident is material, on Form 8-K, Item 1.05.
Lesson quiz · 5 questions
Score 60% or more to complete this lesson.
Create a free account to save your progress, take quizzes and earn a certificate.