
HSE-103 · Lesson 9 of 12 · 25 min
Specialized risk assessment methods
Job hazard analysis and risk matrices suit most workplace tasks, but complex systems, such as chemical processes, automated machinery, utilities and major projects, need more structured methods. These methods are usually led by trained facilitators and specialists, but workers, supervisors and committee members often take part, and understanding them helps everyone contribute and use the results. This lesson introduces, at an awareness level, checklist and what-if analysis, hazard and operability studies (HAZOP), failure modes and effects analysis (FMEA), fault tree and event tree analysis, bow-tie analysis, layers of protection analysis, and machinery risk assessment, with guidance on choosing a method. It is not training to lead these studies, which requires specialized instruction and experience.
Choosing a method
Different methods suit different questions and stages of a project. Simpler methods, such as checklists and what-if analysis, are quick and flexible. Systematic methods, such as HAZOP and FMEA, examine every part of a system methodically and are more thorough but take more time and expertise. Logic-based methods, such as fault trees and event trees, model how failures combine and can be quantified. Bow-tie analysis visualizes causes, consequences and controls together and is good for communication. Standards such as IEC 31010 describe many risk assessment techniques and their strengths.
| Method | Approach | Typical use |
|---|---|---|
| Checklist | Compare against known hazards and requirements | Routine reviews, compliance, simple systems |
| What-if | Brainstorm "what if…?" questions | Early design, procedures, small processes |
| HAZOP | Apply guide words to process parameters | Chemical and process systems |
| FMEA | Examine how each component can fail | Equipment, products, maintenance planning |
| Fault tree | Logic tree of causes leading to a top event | Complex failures, quantification |
| Event tree | Branches of outcomes after an initiating event | Escalation and protective system success |
| Bow-tie | Causes, event, consequences and barriers in one diagram | Major hazards, communication, critical controls |
| LOPA | Semi-quantitative check of independent protection layers | Process safety, safety instrumented systems |
Checklist and what-if analysis
Checklist analysis compares a system, design or procedure against a list of known hazards, requirements and good practices, drawn from codes, standards, past incidents and experience. It is efficient and ensures known issues are not missed, but it may miss hazards that are new or specific to the system. What-if analysis is a structured brainstorming method: a team familiar with the system asks questions such as "What if the pump fails?", "What if the wrong chemical is delivered?", "What if the operator is called away during filling?" and "What if power is lost?", and records the consequences, existing safeguards and recommendations. Combining the two, called what-if/checklist analysis, uses a checklist to prompt questions. These methods are accessible to non-specialists and suitable for small processes, procedures and early design reviews.
Hazard and operability study (HAZOP)
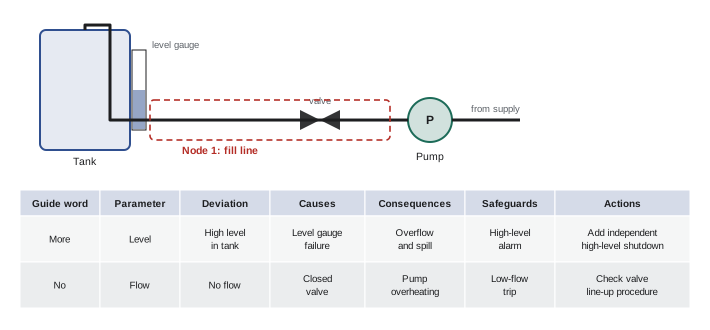
A HAZOP, developed in the chemical industry in the 1960s and described in standard IEC 61882, examines a process systematically, section by section (called nodes), using guide words combined with process parameters to identify deviations from the design intent. Guide words include no, more, less, reverse, part of, as well as and other than; parameters include flow, pressure, temperature, level and composition. For example, "no flow", "more pressure" or "reverse flow" in a pipeline. For each credible deviation, the team identifies possible causes, consequences, existing safeguards and recommendations. A HAZOP team typically includes a trained facilitator, a scribe, process and design engineers, operators, maintenance and instrument specialists, and safety personnel, working from detailed piping and instrumentation diagrams. HAZOPs are thorough but time-consuming, and are commonly used for new processes, significant modifications and periodic revalidation of process hazard analyses.
Failure modes and effects analysis (FMEA)
FMEA examines each component of a system, such as a pump, valve, sensor or software function, and asks how it can fail (its failure modes), what the effects of each failure would be, how the failure would be detected, and what controls exist. In many FMEAs, each failure mode is rated for severity (S), occurrence (O) and detection (D), often on scales of 1 to 10, and multiplied to give a risk priority number:
Higher numbers indicate higher priority. Like risk matrix scores, RPNs have weaknesses: they multiply ordinal scales and can rank a high-severity failure below a lower-severity one. The automotive industry's AIAG and VDA FMEA handbook, published in 2019, replaced the RPN with action priority tables that give more weight to severity. FMEA is widely used in manufacturing, product design, maintenance planning and medical devices, and it complements HAZOP for equipment-focused analysis.
Worked problem
Calculating and interpreting RPNs
An FMEA of a forklift battery charging station rates two failure modes on 1–10 scales. (a) Charger overheats due to a failed fan: S = 7, O = 3, D = 4. (b) Hydrogen build-up from inadequate ventilation leading to explosion: S = 10, O = 2, D = 6. Calculate the RPNs and comment.
Show solution
- RPN (a) = 7 × 3 × 4 = 84.
- RPN (b) = 10 × 2 × 6 = 120.
- Failure mode (b) has the higher RPN and, more importantly, a severity of 10, indicating potential fatalities.
- Most organizations would act on (b) regardless of RPN, for example by verifying ventilation design, adding hydrogen detection interlocked with the chargers, and controlling ignition sources.
Answer: RPNs of 84 and 120; the hydrogen explosion mode needs priority action because of its catastrophic severity.
Fault tree and event tree analysis
Fault tree analysis starts with an undesired top event, such as "tank overflow" or "release of toxic gas", and works backward, using logic gates, to identify the combinations of equipment failures, human errors and conditions that could cause it. An AND gate means all inputs must occur; an OR gate means any input is enough. Fault trees show where single failures can cause the top event and where multiple independent failures are needed, and with failure rate data they can estimate the probability of the top event. Event tree analysis works forward from an initiating event, such as a leak, branching on the success or failure of each protective measure, such as detection, isolation, ignition prevention and emergency response, to show the range of possible outcomes and their likelihood.
Bow-tie analysis
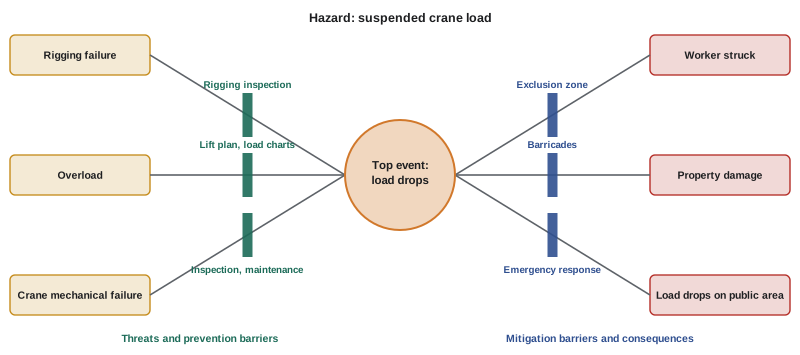
A bow-tie diagram combines fault tree and event tree thinking in a simple visual format. In the centre is the top event, the moment control of the hazard is lost, such as "loss of containment of flammable liquid" or "load drops from crane". On the left are threats, the causes that could lead to the top event, each with prevention barriers that stop the threat from causing the event. On the right are consequences, such as fire, injury or environmental damage, each with mitigation or recovery barriers that limit the harm. Escalation factors, which can make barriers fail, and their controls are also shown. Bow-ties are popular in oil and gas, mining, aviation and health care because they make it easy to see which barriers exist, which are critical, and who is responsible for each, and they support critical control management (Lesson 8).
Layers of protection analysis (LOPA)
LOPA is a semi-quantitative method used mainly in process safety. For each hazardous scenario identified, often in a HAZOP, it estimates the frequency of the initiating event and credits each independent protection layer, such as a basic process control system, an alarm with operator response, a safety instrumented system or a relief valve, with a probability of failure on demand, typically by factors of ten. Multiplying these gives an estimated frequency of the consequence, which is compared with the organization's risk tolerance criteria to decide whether more protection is needed. Protection layers must be independent, specific, dependable and auditable. LOPA also helps determine the required safety integrity level (SIL) for safety instrumented systems under standards such as IEC 61511.
Machinery risk assessment
Machinery has its own risk assessment framework. ISO 12100 sets out general principles for the design of safe machinery: determining the limits of the machine, identifying hazards across its life cycle, including installation, operation, setting, cleaning, maintenance and decommissioning, estimating and evaluating risk, and reducing risk through inherently safe design, safeguarding and complementary measures, and information for use. Standards such as ISO 13849 set requirements for the safety-related parts of control systems, such as interlocks and emergency stops, using performance levels. In Canada, CSA Z432 covers safeguarding of machinery; in the United States, ANSI B11 standards cover machine tools and ANSI/RIA standards cover industrial robots. Workers and maintenance staff provide valuable input on how machines are actually used and serviced.
Participating in specialized studies
If you are invited to take part in a HAZOP, FMEA, bow-tie workshop or machinery assessment, your knowledge of how the system is really operated and maintained is valuable. Prepare by reviewing the drawings or procedures, bring examples of problems and near misses, ask questions when something is unclear, and speak up about practical issues, such as valves that are hard to reach or alarms that sound so often they are ignored. After the study, follow up on recommendations relevant to your work, and make sure procedures and training reflect the results.
Choosing the right method
Specialized methods take time and expertise, so they should be matched to the complexity and potential consequences of the system being studied. A simple task with familiar hazards needs no more than a job hazard analysis. A new piece of equipment with several failure modes may suit an FMEA. A continuous chemical process with potential for fires, explosions or toxic releases calls for a HAZOP. A specific scenario with catastrophic potential, such as a vessel overpressure, may be examined with a bow-tie to communicate barriers and with LOPA to decide whether the barriers are sufficient. A what-if or checklist review is often enough for small changes or simple systems. Many organizations use a tiered approach, starting with a coarse screening of all activities and applying detailed methods only where screening shows significant risk.
Running a study team
Specialized studies depend on a good team. A HAZOP or FMEA team typically includes a trained facilitator independent of the design, a scribe, a process or design engineer, an experienced operator, a maintenance representative, and specialists such as instrumentation, safety or chemistry experts as needed. The facilitator keeps the study systematic, encourages participation and prevents the discussion from turning into redesign during the meeting. Sessions are best limited to a few hours a day to avoid fatigue. Up-to-date drawings, procedures, data sheets and incident histories must be available. Recommendations are recorded with owners and due dates and tracked to completion, and the study is revalidated when the system changes or at set intervals.
Limits of the methods
Every method has blind spots. HAZOP is strong for process deviations but weaker for human factors and organizational issues. FMEA examines single failures well but can miss combinations of failures and common causes. Bow-ties show barriers clearly but do not on their own show how reliable those barriers are. LOPA depends on assumed failure frequencies that may not fit a particular site. Recognizing these limits, combining methods where appropriate and treating the results as aids to judgement rather than precise predictions leads to better decisions.
For most readers of this course, the goal is not to lead a HAZOP or calculate LOPA frequencies, but to understand what these studies do, to contribute knowledge as a team member, to read their results, and to recognize when a situation is complex enough to call in specialists.
Specialized studies are also valuable when shared: summaries of their key scenarios and barriers make good material for operator training, toolbox talks and emergency drills, so the knowledge reaches the people whose actions keep those barriers working.
When specialist studies are done by consultants, the organization should make sure its own people take part and understand the results, so that the knowledge stays in the workplace after the consultants leave.
Common mistakes
MistakeUsing a complex method for a simple task.
InsteadMatch the method to the complexity and risk.
MistakeRunning a HAZOP without operators.
InsteadInclude people who operate and maintain the system.
MistakeRanking failure modes by RPN alone.
InsteadGive priority to high-severity failure modes.
MistakeCrediting protection layers that are not independent.
InsteadCredit only independent, dependable, auditable layers.
MistakeFiling study recommendations without action.
InsteadTrack recommendations to completion.
Summary and key terms
- Specialized methods suit complex systems and major hazards.
- Checklists and what-if analysis are quick and accessible.
- HAZOP applies guide words to process parameters to find deviations.
- FMEA examines component failure modes; RPN has known weaknesses.
- Fault trees work backward from a top event; event trees work forward.
- Bow-ties show threats, consequences and barriers together.
- LOPA and machinery standards provide structured risk reduction.
- What-if analysis
- Structured brainstorming of possible deviations.
- HAZOP
- Hazard and operability study using guide words.
- Guide word
- Word such as more, less or no applied to a parameter.
- Node
- Section of a process examined in a HAZOP.
- FMEA
- Failure modes and effects analysis.
- RPN
- Risk priority number: severity × occurrence × detection.
- Fault tree
- Logic diagram of causes leading to a top event.
- Bow-tie
- Diagram of threats, top event, consequences and barriers.
- LOPA
- Layers of protection analysis.
- Independent protection layer
- Safeguard that works independently of others.
Practice problems
Work each problem on paper first, then reveal the answer to check.
When is what-if analysis suitable?
Show answer
Early design, procedures and small processes.
Name four HAZOP guide words.
Show answer
No, more, less, reverse, part of, as well as, other than.
What is a HAZOP node?
Show answer
A section of the process examined in turn.
Calculate RPN for S = 8, O = 4, D = 3.
Show answer
96.
Why is RPN criticized?
Show answer
It multiplies ordinal scales and can underweight severity.
What does an AND gate mean in a fault tree?
Show answer
All inputs must occur.
What is in the centre of a bow-tie?
Show answer
The top event, when control is lost.
What are the two sides of a bow-tie?
Show answer
Threats with prevention barriers; consequences with mitigation barriers.
What does LOPA compare its result against?
Show answer
Risk tolerance criteria.
Which standard sets general principles for safe machinery?
Show answer
ISO 12100.
Lesson quiz · 5 questions
Score 60% or more to complete this lesson.
Create a free account to save your progress, take quizzes and earn a certificate.