
ELV-430 · Lesson 11 of 12 · 22 min
Troubleshooting mechanical faults: noise, vibration and ride quality
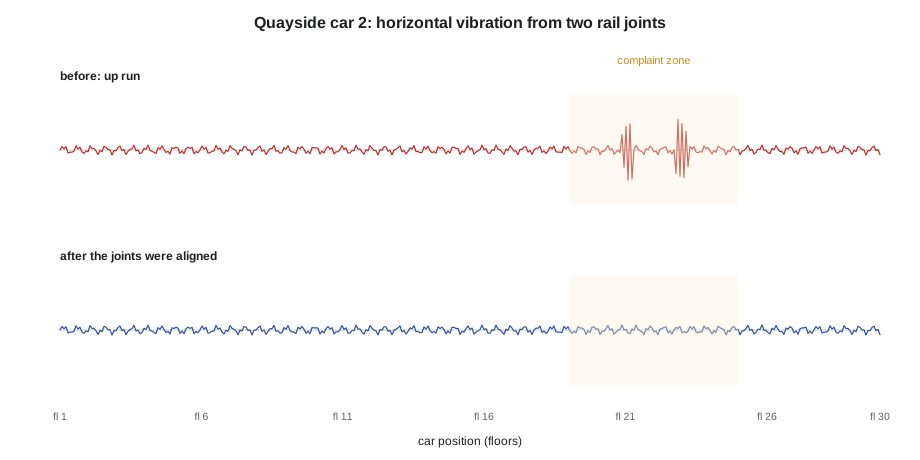
Mechanical faults rarely stop a car outright. They show up first as noise, vibration and a ride that feels wrong, and the people who notice are the passengers. A tenant at Quayside Tower complained that car 2 shook sideways between the 18th and 24th floors; Larchmont's building manager reported a groaning noise from car 1 at night; and Nell Brady asked Tamsin to listen to escalator E3 at Brackenridge Centre, whose step chain had developed a rhythmic knock. This lesson covers finding mechanical faults by their noise and vibration: how ride quality is measured, how a vibration's frequency points to its source, and the common causes in rails and guides, ropes and sheaves, machines and bearings, doors, hydraulic systems and escalators. It also covers measuring Tillicum car 1's ride after its modernization, which became the baseline in its new maintenance control program.
Measuring ride quality
Ride quality is measured with an accelerometer on the car floor, recording vertical and horizontal acceleration through complete runs, and a sound level meter at the passenger's head height. ISO 18738-1 describes how to measure and report it, without setting limits: it defines measures such as the maximum peak-to-peak vibration in each axis and the A95 value, the peak-to-peak level that 95 % of the vibration during the constant-speed part of the run stays below, along with the maximum acceleration, deceleration and jerk, and the sound level. Results are reported in milli-g, thousandths of the acceleration due to gravity, which is a convenient size: a passenger notices horizontal vibration of a few tens of milli-g, and a well-adjusted car in good condition is typically well below that. Specifications for new and modernized cars often set their own limits for these measures; Tillicum's specification did.
# Ride quality summary from one constant-speed section of a run (horizontal axis), in milli-g
import math, random
random.seed(3)
fs = 256                                  # samples a second
t = [i / fs for i in range(fs * 8)]        # 8 s of constant speed
# synthetic recording: a 2 Hz sway, a 5 Hz component and random roughness
x = [4 * math.sin(2 * math.pi * 2.0 * s) + 2.5 * math.sin(2 * math.pi * 5.0 * s) + random.gauss(0, 1.2) for s in t]
# peak-to-peak values in successive quarter-second windows
win = fs // 4
pp = sorted(max(x[i:i + win]) - min(x[i:i + win]) for i in range(0, len(x) - win, win))
max_pp = pp[-1]
a95 = pp[math.ceil(0.95 * len(pp)) - 1]
print(f"maximum peak-to-peak {max_pp:.1f} mg, A95 about {a95:.1f} mg (from {len(pp)} windows)")
print("against the specification limit of 20 mg:", "within" if max_pp <= 20 else "over")maximum peak-to-peak 13.4 mg, A95 about 13.1 mg (from 31 windows) against the specification limit of 20 mg: within
The calculation is a simplified version of the standard's method, which uses defined filters and the zero crossings of the signal rather than fixed windows, but it shows the idea: a few large peaks matter to the maximum, while the A95 describes how the ride feels most of the time. The measuring device used on site does the processing and prints the report; the mechanic's job is to mount it firmly, run it under the conditions in the test plan (empty and loaded, up and down, the full travel and short runs), and read the report intelligently.
Frequency points to the source
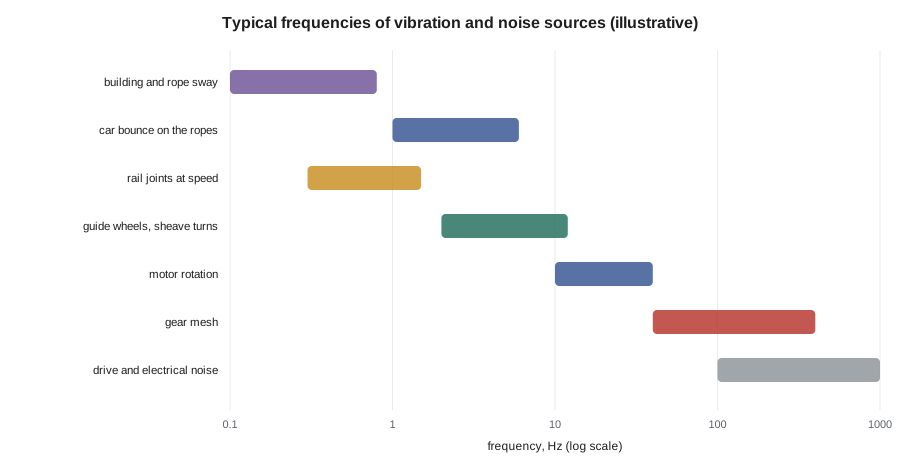
Every rotating or repeating part of an elevator produces vibration at a frequency set by its speed and geometry, and the frequency of a vibration is the best clue to its source. A car running at constant speed past rail joints spaced at regular intervals feels a bump at each joint, so a misaligned joint produces vibration at the car speed divided by the joint spacing. A guide roller with a flat spot knocks once per revolution, at the car speed divided by the roller's circumference. A sheave or motor with a fault produces vibration at its rotational speed or a multiple of it. A gear produces vibration at its tooth mesh frequency, the number of teeth passing a point each second. A drive or motor fault often shows at multiples of the supply frequency or the motor's electrical frequency. Building sway and rope vibration show as low frequencies, often a few hertz or less.
# Candidate source frequencies for Quayside car 2 (gearless, 2:1 roping) at rated speed
import math
v = 2.5                       # car speed, m/s
v_ms = v * 1.0               # m/s
rail_joint = 5.0             # rail length between joints, m
roller_d = 0.15               # roller guide wheel diameter, m
sheave_d = 0.4               # drive sheave diameter, m
roping = 2
cands = {
    "rail joints": v_ms / rail_joint,
    "roller guide wheel, once per turn": v_ms / (math.pi * roller_d),
    "drive sheave, once per turn": v_ms * roping / (math.pi * sheave_d),
}
for k, f in cands.items():
    print(f"{k:36s} {f:6.2f} Hz")
measured = 0.5             # dominant frequency in the complaint zone, Hz
best = min(cands, key=lambda k: abs(cands[k] - measured))
print(f"measured {measured} Hz is closest to: {best}")rail joints 0.50 Hz roller guide wheel, once per turn 5.31 Hz drive sheave, once per turn 3.98 Hz measured 0.5 Hz is closest to: rail joints
The dominant frequency in the complaint zone at Quayside was half a hertz, one bump every two seconds, which matched the rail joints at rated speed, and the vibration was horizontal and confined to a band of floors. That pointed to the rail joints in that band, not to the rollers or the machine. Ray and Tamsin checked the rails from the car top with a straight-edge and feeler gauges and found two joints near the 20th and 22nd floors where the rail faces were offset at the joint by more than the alignment tolerance, probably from building settlement or a bracket that had slipped. The joints were realigned by loosening the fishplates and brackets, aligning the rail faces, filing the joint smooth and retightening; the next ride test showed the horizontal peak-to-peak in that band reduced to the level of the rest of the hoistway.
Finding a frequency in a recording
Modern ride quality instruments calculate the frequency content of a recording automatically, but understanding what they do helps the mechanic trust or question the result. A recording is a mixture of vibrations at different frequencies; a frequency analysis separates them and shows how strong each is. The code below does this with a simple discrete Fourier transform on a short synthetic recording containing two vibrations, and finds the strongest.
# Find the strongest frequencies in a vertical vibration recording (simple discrete Fourier transform)
import math, random
random.seed(11)
fs = 64                                    # samples a second
n = 512                                    # 8 s of data
sig = [5 * math.sin(2 * math.pi * 3.1 * i / fs) + 2 * math.sin(2 * math.pi * 12.4 * i / fs) + random.gauss(0, 1) for i in range(n)]
def amplitude(f):
    re = sum(s * math.cos(2 * math.pi * f * i / fs) for i, s in enumerate(sig))
    im = sum(s * math.sin(2 * math.pi * f * i / fs) for i, s in enumerate(sig))
    return 2 * math.hypot(re, im) / n
freqs = [k * fs / n for k in range(1, n // 2)]
spec = sorted(((amplitude(f), f) for f in freqs), reverse=True)
peaks = []
for a, f in spec:
    if all(abs(f - p) > 0.5 for _, p in peaks):
        peaks.append((a, f))
    if len(peaks) == 3:
        break
for a, f in peaks:
print(f"{f:5.2f} Hz amplitude {a:4.1f} mg")3.12 Hz amplitude 4.6 mg 12.38 Hz amplitude 1.9 mg 6.00 Hz amplitude 0.3 mg
In the recording, the strongest vibration is near 3 Hz and the next near 12 Hz. On a real car, a vertical vibration of a few hertz often comes from the suspension, the car bouncing on its ropes like a mass on a spring, made worse by unequal rope tensions or a drive speed loop that is not damped; a higher frequency could come from the machine or a roller. The frequency names the suspects, and the measurements in the hoistway and machine room decide.
Ropes, sheaves and machines
Unequal rope tensions make the ropes slip differently in their grooves, wear the grooves unevenly and cause vertical vibration and noise. ELV-230 showed how to measure and equalize tensions; on a ride complaint, rope tension is one of the first checks because it is quick and often the answer. Sheave groove wear, a damaged rope and a failing deflector sheave bearing all produce noise at the sheave's rotational frequency. On geared machines, gear mesh noise rises as the gear wears or the oil degrades, and bearing faults produce a characteristic growl or tick that a mechanic's stethoscope, a screwdriver held against the housing or a vibration meter can locate. On gearless machines, noises usually come from the brake, the bearings or the drive, and a magnetic hum that changes with load can point to a drive tuning problem rather than a mechanical one.
Larchmont car 1's night-time groan turned out to be one of the most common noises in machine-room-less cars: the coated steel belts creaking over the drive and diverter sheaves as the building cooled at night and the car sat for long periods. The belts and sheaves were cleaned as the maker described, a belt that had been rubbing a guard was realigned, and the car's parking floor was changed so that it did not sit for hours with the same section of belt bent over the drive sheave. Not every noise is a fault, but every noise has a cause, and the cause decides whether it matters.
Doors, hydraulics and escalators
Doors make most of the noises passengers hear: hangers with worn rollers, tracks with dirt or flat spots, gibs scraping in the sill groove, closers banging, operators with worn belts or loose mountings, and door panels rubbing their frames. Each is found by watching and listening to the door through its cycle at the floor where the noise is heard, then from the car top with the car at that floor. Hydraulic cars add valve noise, which often changes with oil temperature, pump noise from worn pumps or air in the oil, and packing noise from a dry or worn packing at the cylinder head. On escalators, noises come from the step chains and their rollers, the step wheels on the tracks, the handrail drive, the comb plates and the main drive chain, and a regular knock is usually timed by a part that passes once a cycle.
# Brackenridge E3: what passes once every knock?
step_speed = 0.5                    # m/s
v_ms = step_speed
knock_interval = 76.0               # seconds between knocks, from a stopwatch over 20 knocks
chain_pitch = 0.1333                # step chain pitch, m (one step per two pitches on this unit, illustrative)
step_length = 2 * chain_pitch
chain_length = 38.0                 # step chain loop length, m
cands = {
    "every step passing a point": step_length / v_ms,
    "every chain link passing a point": chain_pitch / v_ms,
    "one full chain loop": chain_length / v_ms,
}
for k, t in cands.items():
    print(f"{k:32s} {t:7.2f} s")
best = min(cands, key=lambda k: abs(cands[k] - knock_interval))
print(f"knock every {knock_interval} s matches: {best}")every step passing a point 0.53 s every chain link passing a point 0.27 s one full chain loop 76.00 s knock every 76.0 s matches: one full chain loop
Nell's knock came once a minute and a quarter, once per full loop of the step chain, which meant one particular place on the chain, not every step. She and Tamsin marked the step that was at the top landing at each knock and found the same step every time; one of its chain rollers had a flat spot and a cracked tyre. The roller was replaced, the others on that section checked, and the knock was gone. A knock that comes once per loop is one part; a noise at every step is a track, a comb or every roller.
Tillicum car 1's baseline
Before the acceptance inspection, Priya and Tamsin ran Tillicum car 1's ride test as the specification required: empty and with rated load, up and down over the full travel, and one-floor runs. The horizontal vibration was low, as expected on a low-speed car with good rails, and the vertical vibration showed the small, regular components of the worm gear and the motor, all inside the specification's limits. The sound level in the car during a run was a few decibels quieter than before, because the motor-generator set no longer ran in the machine room above. The report was filed with the pretest results as the car's baseline, so that a future mechanic investigating a ride complaint could compare a new recording with the car as it was when modernized.
Worked problem
Vibration that changes with load
A car's vertical vibration at constant speed is low when empty and much higher with a full load, and the frequency does not match any rotating part. What are likely causes and checks?
Show solution
- Vibration that rises with load and has no rotating-part frequency suggests the suspension or the drive's control, not a worn part.
- Check the rope or belt tensions for equality, because unequal tensions worsen bounce under load.
- Check the drive's speed loop tuning with a full car; a lightly damped loop can amplify the car's bounce on its ropes.
- Record before and after each change, changing one thing at a time.
Answer: Check suspension tensions and the drive's loaded tuning, one at a time, measuring after each change.
Common mistakes
MistakeTreating ride complaints as opinions.
InsteadMeasure ride quality with an accelerometer and a sound meter and compare with the baseline.
MistakeLooking for the source before working out the frequency.
InsteadCalculate candidate frequencies from speeds and geometry, then match.
MistakeJudging a ride by its worst peak only.
InsteadUse the maximum and the A95 together; one describes the worst, the other the usual.
MistakeAssuming every noise is a failing part.
InsteadFind its cause; some noises are conditions that can be managed.
MistakeSkipping the baseline after a modernization.
InsteadRecord ride quality at acceptance for future comparison.
Summary and key terms
- Ride quality is measured with an accelerometer and a sound meter; ISO 18738-1 describes the measures, such as maximum peak-to-peak and A95, in milli-g.
- Vibration frequency points to the source: rail joints, guide wheels, sheaves, gears, motors and the suspension each have characteristic frequencies.
- Frequency analysis separates a recording into its components; the strongest names the suspects.
- Rope tension, groove wear, gear mesh and bearings are common machine-room sources; doors make most passenger-heard noises.
- Escalator knocks timed once per chain loop point to one part; at every step, to a track, comb or all rollers.
- A modernized car's ride test becomes its baseline.
- Ride quality
- The vibration, acceleration, jerk and noise a passenger experiences, measured during runs.
- Milli-g
- One thousandth of the acceleration due to gravity, the usual unit for elevator vibration.
- A95
- The peak-to-peak vibration level that 95 % of a run stays below.
- Peak-to-peak
- The difference between the highest and lowest values of a vibration in a period.
- Gear mesh frequency
- The rate at which gear teeth pass a point, a source of machine noise.
- Frequency analysis
- Separating a vibration recording into the frequencies it contains.
Practice problems
Work each problem on paper first, then reveal the answer to check.
What does A95 describe?
Show answer
The vibration level that 95 % of the constant-speed run stays below, describing the usual ride.
How is the rail joint vibration frequency calculated?
Show answer
Car speed divided by the rail length between joints.
Why did Quayside's vibration appear only between certain floors?
Show answer
Two misaligned rail joints were in that band.
What does a knock once per escalator chain loop indicate?
Show answer
One particular part on the chain, such as one roller.
Why record ride quality after a modernization?
Show answer
As a baseline to compare with future complaints.
Lesson quiz · 5 questions
Score 60% or more to complete this lesson.
Create a free account to save your progress, take quizzes and earn a certificate.