
ELV-310 · Lesson 8 of 12 · 21 min
Motion control: speed profiles, jerk and levelling
Passengers judge an elevator by three things they can feel: how long they wait, how long the ride takes, and how smooth it is. The second and third are set by the speed profile, the curve of speed against time that the controller and drive follow on every run. Tillicum car 1's profile is a staircase: the generator field resistance is cut out in two steps, the car lurches up to speed, runs, drops to a slow levelling speed and creeps the last few centimetres (inches) to the floor. Quayside car 2's profile is a smooth S that starts gently, accelerates firmly, cruises, and lands the car on the floor without a creep. Priya spent two days of the term with Tamsin on a drive's tuning screens and a ride quality meter, because the profile is where adjustment becomes craft.
Speed, acceleration and jerk
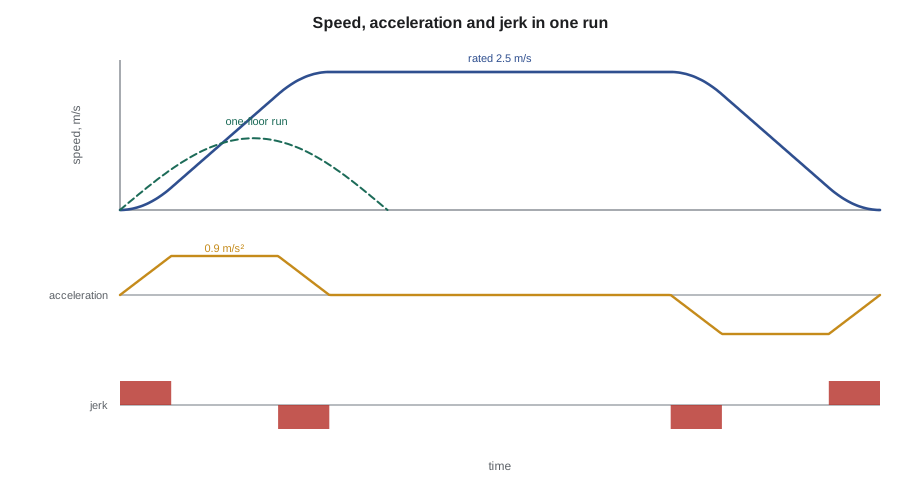
Three quantities describe a profile. Speed is how fast the car moves. Acceleration is how fast the speed changes, and it is what a passenger feels as a push into the floor going up or a lightness at the start of a down run. Jerk is how fast the acceleration changes, and it is what a passenger feels as the start or end of a push. A profile with a sudden change of acceleration, such as Tillicum's steps, has very high jerk at the steps and feels like a bump. An S-curve profile limits jerk, so the acceleration builds up smoothly at the start of a run, holds, and fades away as the car reaches full speed, and the same in reverse on the way into a floor.
Typical values for a comfortable passenger car are an acceleration of about 0.8 to 1.0 m/s² (2.5 to 3.5 ft/s²) and a jerk of about 1 to 1.5 m/s³ (3 to 5 ft/s³). Hospital cars, which carry patients on stretchers, are often set gentler; express cars in tall buildings sometimes firmer. Higher values make the ride shorter but less comfortable, and there is a point beyond which they save little time, because on most runs the car spends only a small share of its time accelerating.
Here v is the rated speed, a the maximum acceleration and j the jerk. The first equation gives the time to accelerate from rest to full speed with a jerk-limited S-curve; the second gives the distance the car travels while doing it. The deceleration into a floor takes the same time and distance if the profile is symmetrical. A run shorter than twice the acceleration distance never reaches full speed.
# Flight time with a jerk-limited S-curve, for runs of different lengths
v_rated, a, j = 2.5, 0.9, 1.0          # speed, acceleration, jerk
floor = 3.0                            # floor height

def accel(v):
    t = v / a + a / j if v >= a * a / j else 2 * (v / j) ** 0.5
    return t, v * t / 2                 # time and distance to reach speed v

def flight(d):
    t_acc, d_acc = accel(v_rated)
    if d >= 2 * d_acc:
        return 2 * t_acc + (d - 2 * d_acc) / v_rated, v_rated
    lo, hi = 0.0, v_rated               # short run: find the peak speed by halving
    for _ in range(60):
        mid = (lo + hi) / 2
        lo, hi = (mid, hi) if 2 * accel(mid)[1] < d else (lo, mid)
    t, _ = accel(lo)
    return 2 * t, lo

t_acc, d_acc = accel(v_rated)
print(f"to reach full speed: {t_acc:.2f} s over {d_acc:.1f} m")
for floors in (1, 2, 5, 10, 29):
    t, peak = flight(floors * floor)
print(f"{floors:2d} floors ({floors * floor:5.0f} m): flight time {t:5.1f} s, peak speed {peak:4.2f} m/s")to reach full speed: 3.68 s over 4.6 m 1 floors ( 3 m): flight time 4.7 s, peak speed 1.29 m/s 2 floors ( 6 m): flight time 6.1 s, peak speed 1.95 m/s 5 floors ( 15 m): flight time 9.7 s, peak speed 2.50 m/s 10 floors ( 30 m): flight time 15.7 s, peak speed 2.50 m/s 29 floors ( 87 m): flight time 38.5 s, peak speed 2.50 m/s
On a one-floor run Quayside car 2 never gets close to its rated speed, and on a two-floor run it reaches only about three-quarters of it. Most of the trips in an office building are a few floors, so the acceleration and jerk settings, and the door times covered in the dispatching lesson, matter more to passengers than the rated speed. Only on the express run from the lobby to the top does the car spend most of its time at full speed.
How the profile is generated
On Tillicum car 1, the profile is whatever the relays and the generator field produce. The acceleration steps are set by relay timing and field resistor taps; the slowdown point at each floor is set by the selector's slowdown contacts, a fixed distance before the floor; and the final approach is a creep at levelling speed controlled by the levelling switches. Because the slowdown distance is fixed but the car's actual deceleration varies with load and direction, the creep is longer on some stops than others, and the car's stopping accuracy depends on the levelling switches and the brake.
A modern controller calculates the profile for each run. When it starts a run, it knows the target floor's position from the floor table and the car's position from the landing system, so it knows the distance to go. It generates a speed pattern that will cover exactly that distance with the set acceleration and jerk, and either sends the pattern to the drive point by point or gives the drive the target and lets it generate the pattern. As the car approaches the floor, the controller continually compares the car's actual position with the pattern's and corrects the speed command so the car arrives at zero speed exactly at floor level. This is called direct approach or distance-to-go control, and it removes the creep. The brake drops only after the car has stopped under motor control, so the brake holds the car rather than stopping it.
Direct approach depends on accurate position and good tuning of the drive's speed loop. A drive whose speed loop is too slow lets the car lag the pattern and arrive late or overshoot; one whose speed loop is too fast makes the car vibrate or hunt. Drive tuning is done on the maker's screens with the car empty and with test weights, and saved with the parameters. Priya's habit is to run a short series of one-floor and multi-floor runs in each direction with the car empty and loaded, and watch the speed and position traces on the service tool before she changes anything.
Stopping accuracy
How level the car stops is measured at the sill: the difference in height between the car sill and the landing sill when the car has stopped and the doors are open. On a good modern car, it is within a few millimetres (sixteenths of an inch) in all conditions. Accessibility rules call for stopping and levelling accuracy within 13 mm (1/2 in) under rated loading to zero loading conditions, and a car that misses that by a wide margin is a tripping hazard as well as a complaint.
When a car's stops are poor, the pattern of the errors says what to adjust. Errors at one floor only point to the landing system or the sill at that floor, as Lesson 7 described. Errors in the same direction at all floors, such as always stopping high, point to an offset in the levelling or landing system. Errors that depend on the direction of travel, such as stopping high going up and low going down, mean the car is overshooting in both directions, so it is stopping too late; on a relay car, that means the levelling switches release too late or the brake is slow, and on a modern car that the drive is lagging the pattern or the brake drop is late. Errors that depend on the load point to pre-torque, load weighing or speed loop tuning.
# Analyse stopping errors from a series of test stops (positive = car sill above landing sill)
stops = [("up", "empty", 6), ("up", "empty", 7), ("up", "full", 9), ("up", "full", 10),
         ("down", "empty", -5), ("down", "empty", -6), ("down", "full", -9), ("down", "full", -11)]
limit = 13
for key in ("up", "down"):
    errs = [e for d, _, e in stops if d == key]
    print(f"{key:<5} mean error {sum(errs) / len(errs):+6.2f} mm  worst {max(errs, key=abs):+6.2f} mm")
for load in ("empty", "full"):
    errs = [e for _, l, e in stops if l == load]
    print(f"{load:<5} mean size of error {sum(abs(e) for e in errs) / len(errs):5.2f} mm")
up = sum(e for d, _, e in stops if d == "up") / 4
down = sum(e for d, _, e in stops if d == "down") / 4
if up > 0 > down:
    print("high going up and low going down: the car overshoots, it stops too late in both directions")
print("all within the accessibility limit" if all(abs(e) <= limit for *_, e in stops) else "some stops outside the limit")up mean error +8.00 mm worst +10.00 mm down mean error -7.75 mm worst -11.00 mm empty mean size of error 6.00 mm full mean size of error 9.75 mm high going up and low going down: the car overshoots, it stops too late in both directions all within the accessibility limit
These are the figures from Tillicum car 2's stops after its new machine had run for a month, and they show a clean overshoot pattern that grows with load. Priya traced it to a brake drop delay that had been set long during commissioning to soften the stop, and that let the car drift past the floor under load before the brake gripped. Shortening the delay by 80 ms brought every stop inside 4 mm (3/16 in).
Ride quality
Ride quality is more than the profile. Vibration from the guide rails and roller guides, noise from the machine and the air in the hoistway, and small shocks at the start and stop all affect how the ride feels. ISO 18738-1 sets out how to measure the ride quality of a lift: a meter on the car floor records acceleration in three directions and sound during runs, and the results are given as peak-to-peak vibration values and sound levels that can be compared over time or against a specification. Northcrest owns one ride quality meter, and Priya uses it after adjustments on cars with complaints, and on new installations where the specification sets limits.
The start of a run is where many complaints begin. If the brake lifts before the drive has built enough torque to hold the car, the car drops or rolls back slightly before it starts, which passengers feel as a jolt; if the drive builds too much, the car jumps. The pre-torque that the drive applies before the brake lifts depends on the load in the car, which is why load weighing matters for starts, and why a car with a drifting load sensor starts badly. Priya checks starts with the ride quality meter on the floor and the service tool showing the drive's torque and the brake's lift signal side by side.
Terminal slowdown and emergency terminal stopping
The controller's normal profile brings the car to a stop at the terminal floors like any other. Because a fault in the normal control could fail to slow the car for a terminal, codes require independent terminal stopping devices. The normal terminal stopping device, often switches or a separate position check near each terminal, slows and stops the car if the normal control does not. On cars that use buffers shorter than full-speed buffers, an emergency terminal speed limiting device checks that the car is slowing correctly as it approaches the terminal and stops it if it is not. Behind both stand the final terminal stopping switches in the safety circuit, from Lesson 2. On Quayside these functions are part of the certified safety board's supervision of speed and position; on Tillicum they are switches in the hoistway near the top and bottom landings.
Worked problem
Why a one-floor run is slower than it looks
A tenant at Quayside complains that car 2 is slow between floors 12 and 13, a run of 3.0 m (10 ft), and asks why a car rated at 2.5 m/s (500 ft/min) takes several seconds. Using an acceleration of 0.9 m/s² (3.0 ft/s²) and a jerk of 1.0 m/s³ (3.3 ft/s³), explain.
Show solution
- To reach full speed would take about 3.7 s and about 4.6 m (15 ft) of travel, more than the whole run.
- So the car accelerates for half the run and decelerates for the other half, peaking well below rated speed.
- The calculation in this lesson gives a flight time of about 4.7 s for one floor, with a peak speed of about 1.3 m/s (4.3 ft/s).
- Door opening and closing, and the dwell at each floor, add several seconds more.
Answer: On a one-floor run the car never reaches rated speed; the time is set by acceleration, jerk and door times, not by rated speed.
Common mistakes
MistakeRaising acceleration to cure a slow car on short runs.
InsteadShort-run time is set by acceleration, jerk and door times together; raising acceleration alone saves little and costs comfort.
MistakeLengthening the brake drop delay to soften stops.
InsteadA late brake lets the car drift past the floor under load; tune the drive's stop instead.
MistakeAdjusting floors one by one when every stop overshoots.
InsteadAn overshoot in both directions is a timing or tuning problem common to all floors.
MistakeIgnoring a rough start because the stop is good.
InsteadCheck pre-torque and load weighing; a rough start is usually a torque mismatch at brake lift.
MistakeAssuming the rated speed sets the trip time.
InsteadOn most trips the car spends much of its time accelerating and decelerating.
Summary and key terms
- A speed profile is described by speed, acceleration and jerk; limiting jerk gives a smooth S-curve.
- Short runs never reach rated speed; acceleration, jerk and door times set most trip times.
- Relay cars slow at fixed points and creep to the floor; modern cars use distance-to-go control and land without a creep.
- Patterns of stopping error point to causes: one floor, all floors, direction or load.
- Ride quality is measured with a meter on the car floor under ISO 18738-1.
- Terminal stopping devices and emergency terminal speed limiting back up the normal profile near the terminals.
- Speed profile
- The curve of car speed against time during a run.
- Jerk
- The rate of change of acceleration, felt as the start or end of a push.
- S-curve
- A speed profile with limited jerk, so acceleration builds and fades smoothly.
- Distance-to-go control
- Control that generates the speed pattern from the remaining distance to the floor and lands the car without a creep.
- Creep
- Slow levelling-speed travel over the last part of the approach to a floor on older cars.
- Stopping accuracy
- The height difference between car sill and landing sill when the car stops.
- Ride quality
- The vibration and sound passengers experience, measured under ISO 18738-1.
Practice problems
Work each problem on paper first, then reveal the answer to check.
What does a passenger feel as jerk?
Show answer
The start or end of the push of acceleration; limiting it makes the ride smooth.
A car stops high going up and low going down at every floor. What does that mean?
Show answer
It overshoots in both directions, so it stops too late: levelling, brake timing or drive tuning.
Why does a modern car not need to creep to the floor?
Show answer
It calculates its pattern from the distance to go and lands under motor control; the brake drops after it has stopped.
With v = 2.5 m/s, a = 0.9 m/s², j = 1.0 m/s³ (v = 8.33 ft/s, a = 3.0 ft/s², j = 3.3 ft/s³), what is the time to reach full speed?
Show answer
2.5 / 0.9 + 0.9 / 1.0 = 3.68 s (8.33 / 3.0 + 3.0 / 3.3 = 3.69 s).
What causes a jolt at the start of a run?
Show answer
A mismatch between the drive's pre-torque and the load when the brake lifts, often from load weighing drift.
Lesson quiz · 5 questions
Score 60% or more to complete this lesson.
Create a free account to save your progress, take quizzes and earn a certificate.