
CRE-401 · Lesson 9 of 12 · 35 min
Finance for a growing media company
CRE-330 introduced bookkeeping, financial statements and pricing for a creator business. As a company grows, finance becomes a management tool rather than a record-keeping chore. Leaders need to know which shows and products make money, whether the company can afford its next hire, how much cash it will have in six months, and which numbers to watch each week. This lesson covers the profit and loss statement for a media company, budgeting, key performance indicators, unit economics by show and product, and cash-flow forecasting.
The profit and loss statement
The profit and loss statement (P&L), also called the income statement, shows revenue and costs over a period. For a media company it is useful to arrange it in layers:
- Revenue, split by source: advertising, sponsorships, memberships, products, licensing and services.
- Cost of revenue (direct costs): costs that rise with revenue, such as production costs per video, product manufacturing, payment fees and agency commissions.
- Gross profit: revenue minus cost of revenue. Gross margin is gross profit as a percentage of revenue.
- Operating expenses: salaries not tied to a single unit, rent, software, marketing, insurance and professional fees.
- Operating profit: gross profit minus operating expenses. EBITDA (earnings before interest, taxes, depreciation and amortization) is a related measure often used in valuations.
- Net profit: what remains after interest and taxes.
Worked problem
Building a simple P&L
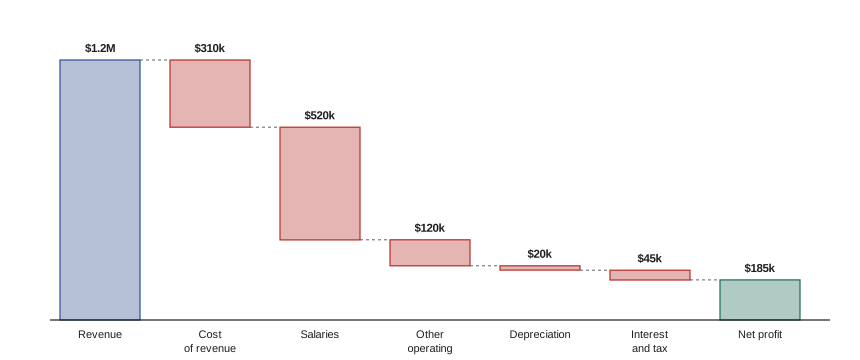
A creator company had annual revenue of $1,200,000: $420,000 from ads, $480,000 from sponsorships, $180,000 from products and $120,000 from memberships. Cost of revenue was $310,000 (freelance production $150,000, product costs $90,000, agency commission $50,000, payment fees $20,000). Operating expenses were $640,000 (salaries $520,000, rent $48,000, software $36,000, other $36,000). Depreciation was $20,000, interest $5,000 and income tax $40,000. Find gross profit, gross margin, EBITDA, operating profit and net profit.
Show solution
- Gross profit: $1,200,000 − $310,000 = $890,000.
- Gross margin: $890,000 ÷ $1,200,000 ≈ 74 %.
- EBITDA: $890,000 − $640,000 = $250,000.
- Operating profit (after depreciation): $250,000 − $20,000 = $230,000.
- Net profit: $230,000 − $5,000 − $40,000 = $185,000.
Answer: Gross profit $890,000 (74 % margin), EBITDA $250,000, operating profit $230,000 and net profit $185,000, a net margin of about 15 %.
Segment profitability
A company-wide P&L can hide important differences. One show may be highly profitable while another loses money; a product line may look large but earn thin margins. Segment reporting splits revenue and direct costs by show, brand or product line, then allocates shared costs fairly, for example by share of editing hours or share of revenue. Be careful with allocations: a segment that looks unprofitable after allocation may still contribute to shared costs, and closing it may not save those costs.
Worked problem
Show-level contribution
Show A earns $600,000 with direct costs of $180,000. Show B earns $250,000 with direct costs of $170,000. Shared costs of $400,000 are allocated by revenue share. Compute each show's contribution and profit after allocation. Should Show B be closed?
Show solution
- Contribution A: $600,000 − $180,000 = $420,000. Contribution B: $250,000 − $170,000 = $80,000.
- Revenue shares: A 600 ÷ 850 ≈ 70.6 %, B ≈ 29.4 %.
- Allocated shared costs: A ≈ $282,400, B ≈ $117,600.
- Profit after allocation: A ≈ $137,600, B ≈ −$37,600.
Answer: Show B looks unprofitable after allocation, but it contributes $80,000 toward shared costs. If closed, and shared costs stayed the same, company profit would fall by $80,000. Leaders should look at whether shared costs would really shrink, and at Show B's growth and strategic value, before deciding.
Budgets
A budget is a plan for revenue and spending over the coming year, usually broken down by month and by department or show. Budgeting forces leaders to make assumptions explicit: how many videos, at what RPM, with how many sponsorships at what rate, and how many staff at what cost. Building the budget from these drivers, rather than simply adding 10 % to last year, makes it easier to see what must go right.
Compare actual results with the budget each month. The difference is called a variance. Investigate large variances, both good and bad, and update the forecast for the rest of the year. Many companies keep the original budget fixed for accountability but maintain a rolling forecast that changes as new information arrives.
| Line | Budget | Actual | Variance | Note |
|---|---|---|---|---|
| Ad revenue | $35,000 | $29,500 | −$5,500 | Seasonal RPM drop deeper than planned |
| Sponsorships | $40,000 | $46,000 | +$6,000 | Extra deal closed early |
| Product sales | $15,000 | $14,200 | −$800 | Within normal range |
| Salaries | $43,000 | $43,000 | $0 | As planned |
| Freelance production | $12,000 | $15,500 | −$3,500 | Extra editing for sponsor deliverables |
Key performance indicators
Key performance indicators (KPIs) are the handful of numbers leaders watch to judge the company's health. A creator company's KPI dashboard might include:
- Audience: views, watch time, subscribers or followers, email list size and returning viewers.
- Revenue: total revenue, revenue by source, RPM, average sponsorship rate and sell-through (the share of available sponsor slots sold).
- Profitability: gross margin, EBITDA margin and contribution by show.
- Efficiency: cost per video, revenue per employee and output per editor.
- Cash: cash balance, runway and days to collect receivables.
- Concentration: share of revenue from the largest platform and the largest sponsor.
Keep the dashboard short, update it on a regular rhythm, and pair each number with a target and an owner.
Worked problem
Revenue per employee
A company with 14 full-time equivalent staff earns $1,750,000 in revenue. A peer company with 9 staff earns $1,260,000. Compare revenue per employee.
Show solution
- Company: $1,750,000 ÷ 14 = $125,000.
- Peer: $1,260,000 ÷ 9 = $140,000.
Answer: The peer generates about $15,000 more revenue per employee, a prompt to look at whether the company's team structure, outsourcing or pricing could improve, while remembering that business models differ.
Cash is not profit
Profitable companies can still run out of cash. Sponsors may pay 60 or 90 days after a video goes live; platforms pay ad revenue a month or more after it is earned; product inventory must be bought before it is sold; and annual costs such as insurance and taxes arrive in lumps. Meanwhile, salaries are paid every two weeks. A cash-flow forecast predicts the cash coming in and going out each month so leaders can see shortfalls before they happen.
Days sales outstanding (DSO) measures how long, on average, customers take to pay.
Worked problem
Days sales outstanding
A company has $210,000 owed by sponsors and platforms at year-end and $1,100,000 a year of revenue paid on credit terms. What is its DSO? If it cut DSO to 45 days, how much cash would be released?
Show solution
- DSO: $210,000 ÷ $1,100,000 × 365 ≈ 69.7 days.
- Receivables at 45 days: $1,100,000 × 45 ÷ 365 ≈ $135,600.
- Cash released: $210,000 − $135,600 ≈ $74,400.
Answer: DSO is about 70 days; cutting it to 45 would free roughly $74,000 of cash, for example by invoicing promptly, asking for deposits and enforcing payment terms.
Worked problem
Three-month cash forecast
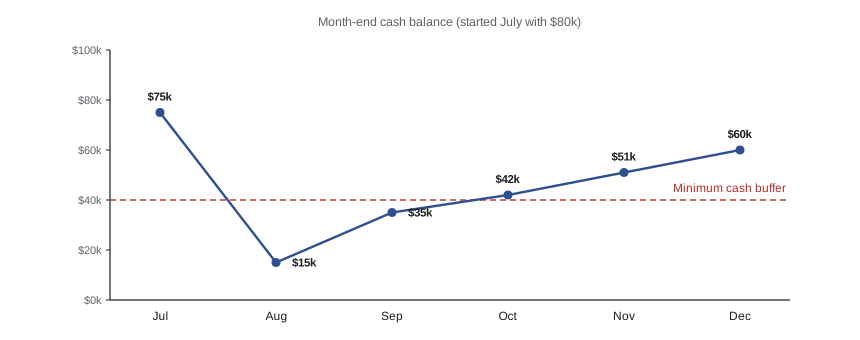
A company starts July with $80,000. Expected cash receipts are $95,000 in July, $70,000 in August and $120,000 in September. Payments are $100,000 a month, plus a $30,000 equipment purchase in August. What is the cash balance at the end of each month, and what is the lowest point?
Show solution
- July: 80,000 + 95,000 − 100,000 = $75,000.
- August: 75,000 + 70,000 − 100,000 − 30,000 = $15,000.
- September: 15,000 + 120,000 − 100,000 = $35,000.
Answer: Cash falls to $15,000 at the end of August, dangerously low. The company could delay the equipment purchase, chase receivables early or arrange a line of credit before August.
Forecasting and scenarios
Forecasts are always wrong in detail, so many companies build three scenarios: a base case, a downside case (for example, ad revenue down 30 % and one major sponsor lost) and an upside case. The downside case is the most useful for planning: it shows whether the company could survive a bad year and what it would cut first. Pre-agreed responses, such as pausing hiring when cash falls below three months of costs, make it easier to act quickly when trouble arrives.
Worked problem
Downside scenario
In the base case, a company expects revenue of $1,200,000 and total costs of $1,050,000. In the downside case, revenue falls 25 % while costs fall only 5 % because most are fixed. What is profit in each case?
Show solution
- Base profit: $1,200,000 − $1,050,000 = $150,000.
- Downside revenue: $1,200,000 × 0.75 = $900,000.
- Downside costs: $1,050,000 × 0.95 = $997,500.
- Downside profit: $900,000 − $997,500 = −$97,500.
Answer: The company swings from a $150,000 profit to a $97,500 loss, showing how fixed costs magnify revenue swings. Plans to cut costs quickly, or a cash reserve, would be needed in that scenario.
Financial controls
As more people handle money, basic controls protect against errors and fraud. Separate duties so the person who approves a payment is not the person who sends it; require two approvals for large payments; reconcile bank accounts monthly; restrict who can change supplier bank details, a common target for scams; and review the P&L and cash forecast monthly. A part-time controller or outsourced accounting firm can provide these controls before the company needs a full-time finance team.
Unit economics by product and customer
For product lines and memberships, unit economics focus on the customer rather than the video. Key measures include customer acquisition cost (CAC), the average cost to win a new paying customer, and lifetime value (LTV), the contribution a customer brings over the whole relationship. A healthy business usually has LTV well above CAC, and recovers CAC within a reasonable payback period.
Worked problem
Membership lifetime value
A membership costs $8 a month; after platform fees and perks, contribution is $6 a month per member. Monthly churn is 5 %. The company spends $9,000 a month on promotion and wins 600 new members a month. What are LTV, CAC and the LTV to CAC ratio?
Show solution
- LTV: $6 ÷ 0.05 = $120.
- CAC: $9,000 ÷ 600 = $15.
- Ratio: $120 ÷ $15 = 8.
Answer: Each member is worth about $120 and costs $15 to acquire, a ratio of 8, which suggests the company could profitably spend more on promotion.
Working with accountants and finance staff
Most small creator companies use an outside bookkeeper and accountant before hiring finance staff. As revenue grows, a part-time or fractional chief financial officer can help with budgeting, forecasting, pricing, fundraising and deal analysis. Monthly closes, meaning books finalized within a couple of weeks after month end, are the foundation: without timely, accurate numbers, none of the tools in this lesson work.
Finance work also connects to every other lesson in this course. Hiring decisions rely on fully loaded costs and break-even, production systems on cost per piece, expansion decisions on contribution and payback, sales on pipeline forecasts, and fundraising and exits on clean, credible statements. Investing early in good financial habits, such as monthly closes, simple dashboards and regular forecasts, pays off at every later stage of growth.
Common mistakes
MistakeLooking only at total profit.
InsteadReport contribution and profit by show, brand and product.
MistakeClosing a segment that still contributes to shared costs.
InsteadCheck whether shared costs would really fall before closing it.
MistakeBudgeting by adding a percentage to last year.
InsteadBuild budgets from drivers such as output, rates and headcount.
MistakeConfusing profit with cash.
InsteadForecast monthly cash, including payment delays and lumpy costs.
MistakePlanning only for the base case.
InsteadBuild a downside scenario with pre-agreed responses.
Summary and key terms
- A layered P&L shows gross profit, EBITDA, operating profit and net profit.
- Segment reporting reveals which shows and products really make money.
- Budgets built from drivers make assumptions explicit; variances show what changed.
- A short KPI dashboard covers audience, revenue, profitability, efficiency, cash and concentration.
- Cash timing differs from profit; DSO measures how fast customers pay.
- Cash forecasts and scenarios reveal shortfalls before they happen.
- Basic financial controls protect against errors and fraud.
- Profit and loss statement
- A report of revenue and costs over a period.
- Cost of revenue
- Direct costs that rise with revenue.
- Gross margin
- Gross profit as a percentage of revenue.
- EBITDA
- Earnings before interest, taxes, depreciation and amortization.
- Segment reporting
- Splitting results by show, brand or product line.
- Variance
- The difference between budgeted and actual results.
- Rolling forecast
- A forecast updated regularly as new information arrives.
- KPI
- A key performance indicator used to judge performance.
- DSO
- Days sales outstanding, the average time customers take to pay.
- Sell-through
- The share of available sponsorship slots that are sold.
Practice problems
Work each problem on paper first, then reveal the answer to check.
Revenue $800,000, cost of revenue $200,000. Gross margin?
Show answer
75 %.
Gross profit $600,000, operating expenses $450,000. EBITDA (no depreciation)?
Show answer
$150,000.
Receivables $90,000 on $730,000 of credit revenue. DSO?
Show answer
45 days.
Start $50,000; receipts $40,000; payments $55,000. End balance?
Show answer
$35,000.
Revenue $2,000,000 with 16 staff. Revenue per employee?
Show answer
$125,000.
Budget $30,000, actual $26,000 for revenue. Variance?
Show answer
−$4,000, worse than budget.
Why can a profitable company run out of cash?
Show answer
Customers pay late while salaries and lumpy costs are due.
Name three KPIs for a creator company.
Show answer
Revenue by source, RPM, sell-through, gross margin, cost per video, cash runway.
What is a downside scenario for?
Show answer
Testing whether the company survives a bad year and planning responses.
Name one financial control.
Show answer
Separate approval and payment, dual approval, monthly reconciliation.
Lesson quiz · 5 questions
Score 60% or more to complete this lesson.
Create a free account to save your progress, take quizzes and earn a certificate.