
CRE-230 · Lesson 3 of 12 · 27 min
Visual hierarchy and composition for small screens
When a viewer glances at a graphic, their eyes go somewhere first, then somewhere else, then perhaps to a third place before they decide whether to keep looking. Visual hierarchy is the deliberate control of that order, so that the most important element is seen first and the rest follows in a logical sequence. On social platforms, where viewers give graphics only a moment, hierarchy is the most important design skill. This lesson covers how hierarchy works, the tools for creating it (size, contrast, colour, position, weight and isolation), focal points, reading patterns, the role of faces and gaze, simplification, the squint and blur tests, and designing for different viewing contexts such as dark mode and bright sunlight.
What hierarchy does
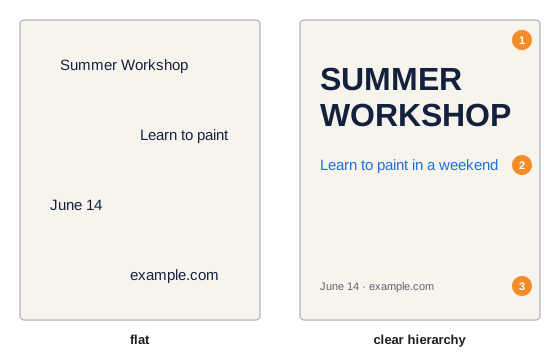
A graphic with clear hierarchy answers three questions in order: what is this, why should I care, and what should I do? The first level, usually a large image or headline, answers the first question in a fraction of a second. The second level, a subheading or supporting image, adds the reason to care. The third level, smaller text or a call to action, invites the next step. A graphic without hierarchy, in which everything is the same size and weight, forces viewers to work out what matters, and most will not bother. Typically, a social graphic should have no more than three levels of hierarchy, and many effective graphics have only two.
Tools for creating hierarchy
Designers create hierarchy through several visual variables, usually combining two or three:
- Size: larger elements are seen first. A headline two to three times the size of the body text clearly dominates.
- Contrast: elements that differ strongly in brightness or colour from their surroundings attract attention.
- Colour: saturated, warm colours such as red, orange and yellow tend to advance and attract the eye; muted and cool colours recede.
- Weight: bold type and thick shapes read before light, thin ones.
- Position: the top of a frame and the upper left in left-to-right languages are usually read first; the centre attracts attention in centred compositions.
- Isolation: an element surrounded by white space stands out.
- Faces and people: human faces, especially eyes, attract attention almost automatically.
Using too many variables at once creates competition: a graphic with a huge headline, a bright red badge, a face and a bold arrow may have no clear first element. Decide which element should win and give it the strongest combination of variables.
| Variable | Stronger | Weaker |
|---|---|---|
| Size | Large | Small |
| Contrast | High contrast with surroundings | Similar to surroundings |
| Colour | Saturated, warm | Muted, cool |
| Weight | Bold, thick | Light, thin |
| Position | Top, upper left, centre | Bottom, corners |
| Isolation | Surrounded by space | Crowded |
Focal points
A focal point is the element the eye goes to first. Every graphic should have one clear focal point, which is usually the subject of the image, the headline, or a combination such as a face looking toward the headline. Secondary focal points support it but should be clearly weaker. Composition principles from VIS-101, such as the rule of thirds, leading lines and framing, help position focal points, but social graphics often use strong central or upper-third placement because thumbnails are small and viewers glance quickly. Placing the focal point where interface elements will cover it, such as the lower right corner of a vertical video, wastes it.
Reading patterns
In left-to-right languages, eye-tracking research has described several common scanning patterns. The Z-pattern describes how viewers scan simple, image-heavy layouts: across the top from left to right, diagonally down to the lower left, then across the bottom. The F-pattern describes how people scan text-heavy pages: across the top, then a shorter line across lower down, then down the left side. For social graphics, these patterns suggest placing the most important text at the top or upper left, putting supporting information along the natural path, and placing calls to action at the end of the path, often lower right or bottom centre. Strong visual elements can override these patterns, which is the point of hierarchy: you can make the eye go where you want. For right-to-left languages such as Arabic and Hebrew, reading patterns are mirrored.
Faces, gaze and direction
Faces are powerful attention magnets, and the direction in which a person in a graphic looks or points guides where viewers look next. A person looking toward a headline draws the viewer's eye to it; a person looking out of the frame draws attention away. Arrows, lines, hands and the direction of movement in an image work similarly. In thumbnails and covers, a face with a clear expression is often the strongest focal point, and positioning the text in the direction of the gaze links the two. Expressions should be genuine and appropriate to the content: exaggerated shock faces may attract clicks but can feel manipulative and are becoming less effective as audiences tire of them.
Worked problem
Using gaze to connect image and text
A cooking creator's cover shows them on the right side looking out of the frame to the right, with the headline "5-minute pasta" on the left. Viewers glance at the face and scroll on. How could the layout be improved?
Show solution
- Flip the photo, or choose another shot, so the creator looks toward the left, where the headline is.
- Alternatively, move the headline to the side the creator is looking toward.
- Enlarge the pasta dish in the foreground so it becomes part of the focal group with the face.
- Keep the headline short and large, with strong contrast against its background.
Answer: Make the creator's gaze point toward the headline and the dish, so attention flows from face to message rather than out of the frame.
Simplify
The most effective way to improve hierarchy is usually to remove things. Each element added to a graphic competes for attention and dilutes the others. A useful exercise is to list every element in a draft, rank them by importance, and ask whether the bottom half of the list needs to be there at all. Logos, website addresses, social handles, dates and decorative shapes often do not; they can go in the caption, the profile or a later slide. Simplification also means reducing the words: three to six words for a thumbnail or cover, one short sentence for a headline, a handful of short bullet points for an information graphic.
The squint, blur and thumbnail tests
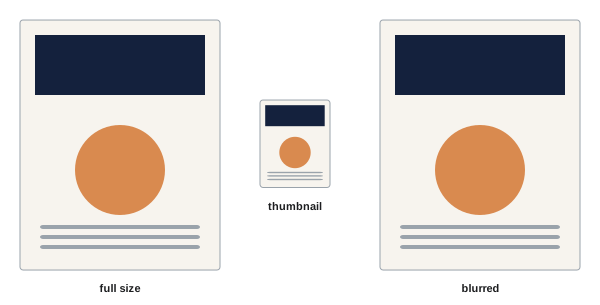
Several quick tests reveal whether hierarchy works. The squint test: squint at the graphic until details blur; the elements that remain visible are the ones viewers notice first. The blur test: apply a temporary blur in your design tool and look for a clear focal point and grouped structure. The thumbnail test: reduce the graphic to the size it will appear in the feed, grid or search results, about 150 to 300 pixels wide for many placements, and check whether the main message is still clear. The five-second test: show the graphic to someone for five seconds and ask what they remember; if they cannot say what it was about, simplify. These tests take seconds and catch most problems before publishing.
Designing for different viewing contexts
Social graphics are viewed in many conditions. In dark mode, white-background graphics appear as bright rectangles that can feel harsh, and dark-background graphics may blend into the interface; a subtle border or a mid-tone background can help. In bright sunlight, low-contrast designs become invisible, so strong contrast matters. On older or smaller phones, text and details shrink further. Some viewers increase text size or use magnification, and some have colour vision deficiencies (Lesson 11). Testing graphics in light and dark mode, at low screen brightness and on more than one device catches many problems.
Hierarchy across a series
In carousels, presentations and template series, hierarchy should be consistent: headlines always in the same place and size, supporting text in the same style, page numbers and logos in fixed positions. Consistency lets viewers learn where to look, speeding comprehension on each new slide. The first slide or cover often uses a stronger, more dramatic hierarchy to stop the scroll, while inner slides use a calmer, consistent structure for reading.
Contrast of scale
One of the strongest hierarchy techniques is a dramatic contrast of scale: one element very large and the rest small. A single word set enormous, a number filling half the frame, or a face cropped tightly beside small text all create immediate focus. Modest differences in size, such as a headline only slightly larger than body text, create ambiguity: the eye cannot tell which is more important. A useful rule is that each level of hierarchy should differ clearly from the next, by at least about 1.5 times in size, or by a combination of size and weight. Bold graphics in feeds often use ratios of three or four to one between headline and supporting text.
Grouping and hierarchy together
Hierarchy works best combined with clear grouping (Lesson 2). A graphic with three levels of hierarchy might have one group at the top (headline and subheading), one in the middle (the image), and one at the bottom (call to action and handle). Within each group, the items are close together; between groups, there is generous space. Viewers then perceive three chunks rather than six separate items, which reduces effort and speeds understanding. If a graphic has more than about four groups, it may be trying to do too much.
Hierarchy for different platforms
Different platforms place graphics in different contexts that affect hierarchy. On YouTube, the thumbnail sits beside the title, so the thumbnail's hierarchy should complement rather than repeat it. On Instagram, the caption appears below the image and may be truncated, so the image carries most of the first impression. On LinkedIn, the first lines of text above the image appear first, so the image supports a written hook. On Pinterest, tall images with large text overlays act like search results, so the text overlay carries the main message. Designing with the surrounding interface in mind leads to better decisions about what the graphic itself must say.
Worked problem
Reducing a cluttered graphic
An event announcement contains a title, subtitle, date, time, location, ticket price, website, two sponsor logos, a social handle and a photo. On a phone it is unreadable. How can it be simplified?
Show solution
- Keep in the graphic: title, date and a strong photo.
- Move time, location, price and website to the caption and the link.
- Place sponsor logos on a separate slide or in the caption, as agreements allow.
- Make the title the clear focal point and the date the second level, with generous margins.
Answer: Reduce the graphic to the title, date and photo, moving secondary details to the caption, link or a later slide.
Hierarchy and honesty
Hierarchy decides what viewers notice first, which gives designers power over impressions. Placing a large discount figure prominently while hiding conditions in tiny text, or emphasizing a dramatic claim while minimizing important caveats, may be technically accurate but misleading. Advertising rules in many places require that important qualifications be clear and prominent, not buried. Use hierarchy to clarify, not to mislead.
Testing hierarchy with others
Hierarchy is easiest to judge with fresh eyes. Show a draft to someone unfamiliar with it on a phone for two seconds, then ask what they saw first and what the graphic was about. If their answer does not match your intended first element, adjust size, contrast or position until it does.
Hierarchy in practice
Practise by redesigning existing posts: take a cluttered graphic, list its elements by importance, and rebuild it with one dominant element, one supporting level and minimal detail, then compare the two versions at thumbnail size.
Common mistakes
MistakeEverything the same size and weight.
InsteadCreate two or three clear levels of hierarchy.
MistakeSeveral elements competing to be first.
InsteadChoose one focal point and give it the strongest variables.
MistakePeople looking out of the frame.
InsteadPoint gaze toward the message.
MistakeAdding logos, handles and dates to every graphic.
InsteadMove secondary details to the caption or profile.
MistakeSkipping small-size tests.
InsteadUse squint, blur, thumbnail and five-second tests.
Summary and key terms
- Hierarchy controls the order in which elements are seen.
- Two or three levels answer what, why and what next.
- Size, contrast, colour, weight, position and isolation create hierarchy.
- Every graphic needs one clear focal point.
- Z- and F-patterns describe common scanning paths.
- Faces and gaze direct attention; point them toward the message.
- Simplify and test with squint, blur, thumbnail and five-second tests.
- Visual hierarchy
- Deliberate order in which elements are seen.
- Focal point
- Element the eye goes to first.
- Visual weight
- How strongly an element attracts attention.
- Z-pattern
- Scanning path across, diagonally down and across.
- F-pattern
- Scanning path for text-heavy layouts.
- Gaze direction
- Where a pictured person is looking.
- Isolation
- Emphasis through surrounding space.
- Squint test
- Blurring vision to see dominant elements.
- Five-second test
- Checking what viewers recall after five seconds.
- Call to action
- Prompt inviting a next step.
Practice problems
Work each problem on paper first, then reveal the answer to check.
What three questions does hierarchy answer?
Show answer
What is this, why care, what to do.
How many hierarchy levels suit most social graphics?
Show answer
Two or three.
Name four hierarchy variables.
Show answer
Size, contrast, colour, weight, position, isolation.
Which colours tend to advance?
Show answer
Saturated warm colours.
Describe the Z-pattern.
Show answer
Across the top, diagonally down, across the bottom.
Where should a pictured person look?
Show answer
Toward the headline or message.
How many words for a cover?
Show answer
About three to six.
What does the squint test show?
Show answer
Which elements dominate.
How wide is a typical thumbnail test?
Show answer
About 150–300 px.
Name a dark mode issue.
Show answer
White graphics look harsh; dark ones blend in.
Lesson quiz · 5 questions
Score 60% or more to complete this lesson.
Create a free account to save your progress, take quizzes and earn a certificate.