
CON-310 · Lesson 9 of 12 · 25 min
Forecasting cost at completion
Every month the project team must answer the question management cares about most: what will this job finally cost? Lesson 6 built that answer line by line, from commitments and judgement. Earned value offers a second set of answers, from formulas that project current performance forward. Neither is right on its own. The formulas are fast, objective and hard to argue with, but they assume the future will resemble the past in a particular way. The bottom-up forecast captures what the team knows about the remaining work, but it is open to optimism. This lesson sets out the standard estimate at completion (EAC) formulas, the to-complete performance index (TCPI) that tests whether a forecast is believable, and how to combine the methods into a forecast that holds up.
Estimate to complete and estimate at completion
The estimate at completion is the expected final cost of the work. It is always actual cost to date plus an estimate to complete (ETC) for the remaining work. The formulas differ only in how they estimate the ETC.
The remaining work, in budget terms, is BAC minus EV. The question is how efficiently that remaining budget will be converted into cost.
The standard formulas
| Formula | Assumption about the remaining work | When it fits |
|---|---|---|
| EAC = AC + (BAC − EV) | Remaining work will be done at budget rates (CPI = 1.0) | Past problems were one-off and will not recur |
| EAC = BAC ÷ CPI | Remaining work will be done at the cumulative CPI to date | Past cost performance is typical of what is to come |
| EAC = AC + (BAC − EV) ÷ (CPI × SPI) | Remaining work affected by both cost and schedule performance | Schedule pressure will raise cost, as on a late job with acceleration |
| EAC = AC + bottom-up ETC | A fresh estimate of the remaining work | Conditions have changed or performance is erratic |
The second formula is algebraically the same as AC + (BAC − EV) ÷ CPI. Because CPI tends to be stable after the early part of a job (Lesson 8), BAC ÷ CPI is often treated as a reasonable lower bound on the final cost of a project already performing below budget: experience suggests outcomes better than BAC ÷ CPI are uncommon once a job is well under way. The third formula, using CPI × SPI, gives a higher figure on a late job and is often treated as a reasonable upper bound when there is schedule pressure.
# EAC by four methods, Riverbend Commons at month 8 (amounts $)
BAC, EV, AC, PV = 16_124_000, 7_907_000, 8_163_000, 8_860_000
CPI, SPI = EV / AC, EV / PV
remaining = BAC - EV
bottom_up_etc = 8_352_000          # from the line-by-line cost report (Lesson 6 method)
methods = {
    "At budget rates  AC + (BAC - EV)": AC + remaining,
    "At cumulative CPI  BAC / CPI": BAC / CPI,
    "CPI x SPI  AC + rem / (CPI*SPI)": AC + remaining / (CPI * SPI),
    "Bottom-up  AC + ETC": AC + bottom_up_etc,
}
print(f"CPI {CPI:.3f}  SPI {SPI:.3f}  remaining budget {remaining:,}")
for name, eac in methods.items():
print(f"{name:<36} EAC {eac:>12,.0f} VAC {BAC - eac:>+11,.0f}")CPI 0.969 SPI 0.892 remaining budget 8,217,000 At budget rates AC + (BAC - EV) EAC 16,380,000 VAC -256,000 At cumulative CPI BAC / CPI EAC 16,646,037 VAC -522,037 CPI x SPI AC + rem / (CPI*SPI) EAC 17,668,464 VAC -1,544,464 Bottom-up AC + ETC EAC 16,515,000 VAC -391,000
The four methods give a range from about $16.4 million to $17.7 million. The budget-rate figure is the most optimistic: it assumes every remaining dollar will be spent exactly as planned, which nothing in the trend supports. The CPI × SPI figure is the most pessimistic, because it lets the 11 % schedule shortfall inflate the cost of all remaining work. The bottom-up forecast sits between BAC ÷ CPI and the budget-rate figure.
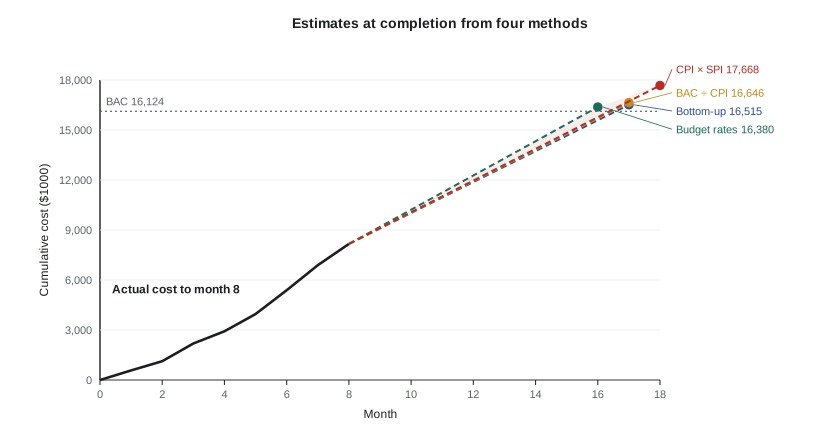
Variance at completion
The variance at completion (VAC) is the budget at completion minus the estimate at completion. A negative VAC is a forecast overrun. VAC is the number that tells management how much of the contingency and fee the job is expected to consume.
The to-complete performance index
The to-complete performance index (TCPI) asks the reverse question: what cost efficiency must the remaining work achieve to finish at a given target? It divides the work remaining by the money remaining.
TCPI is a credibility test. If the project has been working at a CPI of 0.97 and the bottom-up forecast requires a TCPI of 1.10 for the rest of the job, the forecast is assuming a dramatic improvement that should be explained by specific changes. A common rule of thumb is that a TCPI more than about 0.05 to 0.10 above the cumulative CPI deserves serious scrutiny.
BAC, EV, AC = 16_124_000, 7_907_000, 8_163_000
cpi = EV / AC
for label, target in [("Finish on budget (BAC)", BAC), ("Bottom-up EAC", 16_515_000), ("BAC / CPI", BAC / cpi)]:
    tcpi = (BAC - EV) / (target - AC)
print(f"{label:<24} target {target:>12,.0f} TCPI {tcpi:.3f} (cumulative CPI {cpi:.3f})")Finish on budget (BAC) target 16,124,000 TCPI 1.032 (cumulative CPI 0.969) Bottom-up EAC target 16,515,000 TCPI 0.984 (cumulative CPI 0.969) BAC / CPI target 16,646,037 TCPI 0.969 (cumulative CPI 0.969)
To finish on budget, the remaining work would have to run at a TCPI of 1.032, well above the 0.969 achieved so far; that is not credible without major changes. The bottom-up EAC requires 0.984: better than to date, but within reach if the corrective actions on forming work. The BAC ÷ CPI figure requires exactly the current CPI, by definition.
Building a defensible forecast
Experienced project teams use the formulas to frame the forecast rather than to produce it. The line-by-line bottom-up forecast remains the primary number, because only it can reflect commitments, known changes and specific plans. The formulas then act as checks.
| Check | Question it answers |
|---|---|
| Bottom-up EAC compared with BAC ÷ CPI | Is the forecast assuming better performance than the job has shown? |
| TCPI for the bottom-up EAC compared with cumulative CPI | How much improvement does the forecast require, and is it explained? |
| EAC range across methods | How uncertain is the outcome, and is contingency enough? |
| Change in EAC since last month | Is the forecast settling or drifting? |
| Remaining risks and contingency | Do identified risks fit within remaining contingency and fee? |
Worked problem
Explaining a better-than-trend forecast
The bottom-up EAC for Riverbend Commons is $16,515,000, about $131,000 lower than BAC ÷ CPI ($16,646,000). The operations manager asks why the team believes it will do better than the trend. What explanation would be credible?
Show solution
- Most of the overrun to date is in structure, which is 88 % complete; the remaining structure work is small.
- Envelope, mechanical, electrical and interiors are largely subcontracted at fixed prices and are running near CPI 1.0.
- The remaining self-performed work (level 4 and roof forming, carpentry) is forecast at PF 0.92 rather than the 0.82 achieved on levels 2 and 3, because shoring drawings are now approved and an extra foreman is on site.
- The general conditions forecast already includes a one-month extension.
Answer: The explanation is credible because it is specific: the poor performance is concentrated in work that is mostly finished, and the remaining work is mainly fixed-price subcontracts. The team should still show the BAC ÷ CPI figure in the report and track whether the forecast PF of 0.92 is achieved.
This example illustrates a general point about index-based formulas on building projects: they apply the project's average performance to all remaining work, but the mix of remaining work may be very different from the work done so far. A job whose overrun came from self-performed concrete early on, and whose remaining work is mostly bought-out subcontracts, will usually finish better than BAC ÷ CPI. A job whose remaining work is the riskiest part (a complex mechanical fit-out, say) may finish worse. Applying the formulas at the control account level and summing the results often gives a better project EAC than applying them once at the top.
# EAC by control account, then summed (amounts $1000)
accounts = {  # name: (BAC, EV, AC, method)
    "Site and foundations": (1_420, 1_420, 1_455, "complete"),
    "Structure": (3_160, 2_780, 2_960, "cpi"),
    "Envelope": (2_740, 1_370, 1_390, "cpi"),
    "Mechanical and electrical": (3_310, 1_210, 1_200, "budget"),
    "Interiors": (2_880, 175, 180, "budget"),
    "General conditions": (1_904, 952, 978, "time"),
    "Close-out and site works": (710, 0, 0, "budget"),
}
gc_etc = 973                     # time-based, from Lesson 6
total = 0
for name, (bac, ev, ac, how) in accounts.items():
    if how == "complete": eac = ac
    elif how == "cpi": eac = bac / (ev / ac)
    elif how == "time": eac = ac + gc_etc
    else: eac = ac + (bac - ev)
    total += eac
    print(f"{name:<27} {how:<9} EAC {eac:>7,.0f}")
print(f"Project EAC from accounts: {total:,.0f}; whole-project BAC/CPI: {16_124 / (7_907 / 8_163):,.0f}")Site and foundations complete EAC 1,455 Structure cpi EAC 3,365 Envelope cpi EAC 2,780 Mechanical and electrical budget EAC 3,300 Interiors budget EAC 2,885 General conditions time EAC 1,951 Close-out and site works budget EAC 710 Project EAC from accounts: 16,446; whole-project BAC/CPI: 16,646
Summing account-level forecasts gives about $16.45 million, slightly below the bottom-up figure and about $200,000 below the whole-project BAC ÷ CPI, because the subcontracted accounts are forecast at budget rates and only the self-performed and troubled accounts carry their own CPI.
Forecasting the completion date
Cost and time forecasts must be consistent. If the cost forecast assumes the project finishes in month 17, the general conditions, equipment and supervision in the forecast must run to month 17. Earned schedule (Lesson 8) gives an independent estimate of duration, PD ÷ SPI(t); the scheduler's updated critical path gives another. The forecast completion date used for cost should be stated in the cost report and reconciled with the schedule.
Presenting the forecast
Management and owners need a forecast they can act on, not a single number with false precision. A good presentation gives the most likely EAC from the bottom-up forecast, the range from the formula methods, the TCPI the most likely forecast requires, the forecast completion date, and the main risks and opportunities that could move the outcome, with contingency remaining against them. On cost-reimbursable and GMP contracts, the owner will usually receive this information monthly; on lump sum contracts it stays internal, but the same discipline applies.
| Item | Riverbend Commons, month 8 |
|---|---|
| Budget at completion | $16,124,000 |
| Most likely EAC (bottom-up) | $16,515,000 (VAC −$391,000) |
| Range from formulas | $16.38 million (budget rates) to $17.67 million (CPI × SPI) |
| TCPI required by most likely EAC | 0.984 against cumulative CPI 0.969 |
| Forecast completion | Month 17 (earned schedule indicates 17.5) |
| Contingency remaining | $205,000 needed for remaining risks; $66,100 released to offset overruns |
| Projected fee | About $335,000 against $726,000 bid, before any recovery on pending changes |
The projected fee in the table follows from the forecast: the contract value of $16,850,000 less the most likely EAC of $16,515,000 leaves about $335,000. That is less than half the fee bid, and it makes the case for the recovery actions and change pricing that Lessons 10 and 12 discuss.
Common mistakes
MistakeUsing EAC = AC + (BAC − EV) by default.
InsteadUse it only when past problems will not recur; otherwise it is the most optimistic formula.
MistakeReporting a single EAC with no range.
InsteadShow the most likely bottom-up EAC with the range from formula methods.
MistakeAccepting a forecast that needs a TCPI far above the CPI achieved.
InsteadRequire a specific explanation of what will change, and track whether it happens.
MistakeApplying BAC ÷ CPI once at the project level when the remaining work mix is different.
InsteadForecast by control account and sum, using the method that fits each.
MistakeForecasting cost with one completion date and the schedule with another.
InsteadUse one forecast completion date and reconcile it with earned schedule and the critical path.
MistakeLetting the formulas replace knowledge of the work.
InsteadUse the bottom-up forecast as primary and the formulas as checks.
Summary and key terms
- EAC = AC + ETC; the formulas differ in how they estimate the remaining cost.
- AC + (BAC − EV) assumes budget rates; BAC ÷ CPI assumes current cost performance; CPI × SPI adds schedule pressure.
- BAC ÷ CPI is often a practical lower bound once a project is under way and performing below budget.
- VAC = BAC − EAC shows the forecast overrun or underrun.
- TCPI shows the efficiency the remaining work must achieve; a large gap from CPI needs explaining.
- Account-level forecasts summed often beat a single project-level formula.
- Cost and time forecasts must use the same completion date and be presented with a range and risks.
- Estimate at completion (EAC)
- The forecast final cost of the work.
- Estimate to complete (ETC)
- The forecast cost of the remaining work.
- Variance at completion (VAC)
- BAC minus EAC.
- To-complete performance index (TCPI)
- The cost efficiency the remaining work must achieve to meet a target.
- Bottom-up forecast
- A forecast built line by line from commitments, performance and re-estimates.
- Independent EAC
- An EAC calculated from a formula rather than from bottom-up estimates.
- IEAC(t)
- A forecast duration from earned schedule: planned duration divided by SPI(t).
- Lower bound
- A forecast below which the outcome is unlikely to fall.
- Remaining budget
- BAC minus EV: the budget value of work not yet done.
- Forecast range
- The spread of EACs from different methods, showing uncertainty.
Practice problems
Work each problem on paper first, then reveal the answer to check.
BAC = $4.0 million, EV = $1.6 million, AC = $1.8 million. Calculate CPI and BAC ÷ CPI.
Show answer
CPI = 0.889; EAC = $4.5 million.
Using the same values, what is EAC at budget rates?
Show answer
1.8 + (4.0 − 1.6) = $4.2 million.
With SPI = 0.80, what is the CPI × SPI EAC?
Show answer
1.8 + 2.4 ÷ (0.889 × 0.80) = about $5.18 million.
What is the VAC for an EAC of $4.5 million?
Show answer
−$500,000.
What TCPI is needed to finish on budget?
Show answer
(4.0 − 1.6) ÷ (4.0 − 1.8) = 1.09.
Why is a TCPI of 1.09 against a CPI of 0.889 a warning?
Show answer
The forecast assumes a large, unexplained improvement.
When is EAC = AC + (BAC − EV) appropriate?
Show answer
When past variances were one-off events that will not recur.
Why can an account-level EAC differ from a project-level BAC ÷ CPI?
Show answer
Remaining work may have a different mix and performance than work done so far.
A 14-month project has SPI(t) = 0.875. What duration is forecast?
Show answer
16 months.
List four items in a good forecast presentation.
Show answer
Most likely EAC, range, TCPI, completion date, risks and opportunities, contingency remaining.
Lesson quiz · 5 questions
Score 60% or more to complete this lesson.
Create a free account to save your progress, take quizzes and earn a certificate.