
CON-310 · Lesson 6 of 12 · 28 min
Committed costs, cost to complete and the cost report
Actual cost to date is only part of the story. By the time a subcontractor bills its first month, the contractor has already committed to pay it the full subcontract value, and every purchase order issued is money that will be spent whatever happens next. The monthly cost report brings these pieces together: the budget, what has been spent, what has been committed, what is still needed to finish, and the projected final cost of each line. This lesson explains commitments and cost to complete, walks through the columns of a standard cost report, shows how to forecast each line, and covers the review that turns the report into decisions.
Commitments
A commitment is a contractual obligation to spend money in the future. Subcontracts and purchase orders are the main commitments on a building project; equipment rental agreements, consultant agreements and service contracts are others. The committed cost of a line is the total value of its commitments, including approved change orders to them. The open commitment is the part not yet billed or invoiced: committed cost minus cost to date on those commitments.
Tracking commitments gives early warning. If a subcontract is awarded above its budget line, the overrun is known on the day of award, not months later when the final billing arrives. If purchase orders for lumber already exceed the material budget for framing, the overrun is visible before the lumber arrives. A cost report that shows only actual cost would reveal neither until much later.
| Commitment record | What it holds |
|---|---|
| Subcontract or purchase order number | Links the commitment to the vendor and the cost code |
| Original value | Amount at award |
| Approved change orders | Signed changes to the subcontract or order |
| Pending changes | Changes requested or under negotiation, not yet approved (Lesson 10) |
| Billed to date and holdback or retainage | Progress billings approved, with amounts withheld |
| Back-charges | Amounts the contractor will deduct for work it did on the vendor's behalf |
| Open commitment | Committed value not yet billed |
Cost to complete
Cost to complete, often called estimate to complete (ETC), is the cost still needed to finish the work on a line. It is a forecast, and the quality of the whole cost report depends on how it is made. There are three basic approaches, and a good forecast uses the one that fits each line.
| Approach | How cost to complete is set | Best for |
|---|---|---|
| Commitment-based | Open commitment plus expected changes and back-charges | Fully bought-out subcontracts and fixed-price purchase orders |
| Performance-based | Remaining budget adjusted for performance to date | Self-performed labour with measured progress |
| Bottom-up re-estimate | A fresh estimate of the remaining work | Lines where conditions have changed or performance is erratic |
| Time-based | Remaining months × current monthly rate | General conditions and time-related equipment |
For a self-performed labour line, a performance-based forecast divides the remaining budget hours by the expected productivity factor for the rest of the work. The question is which productivity factor to use: the cumulative one to date, a recent one, or the budget rate. The answer depends on whether the causes of past performance will continue. If the crew struggled with a difficult foundation but the remaining work is repetitive slabs, the cumulative factor is too pessimistic. If a design problem has slowed every floor so far, assuming a return to budget is wishful.
Worked problem
Forecasting a labour line
Column forming has a budget of 1,120 h at $81/h ($90,720). It is 55 % complete with 702 actual hours and $57,600 actual cost. The superintendent expects the remaining columns, which are simpler, to run at a productivity factor of 0.95 and the average rate to stay at the current $82.05/h. What is the forecast at completion?
Show solution
- Earned hours: 0.55 × 1,120 = 616 h; cumulative PF = 616 ÷ 702 = 0.88.
- Remaining budget hours: 1,120 − 616 = 504 h.
- ETC hours at PF 0.95: 504 ÷ 0.95 = 531 h.
- ETC dollars: 531 × 82.05 = $43,570.
- Forecast at completion: 57,600 + 43,570 = $101,170.
Answer: About $101,200, or $10,450 over the budget of $90,720. Using the cumulative PF of 0.88 instead would give about $104,700; the difference is the value of the superintendent's judgement, which should be written down so it can be checked next month.
Projected final cost
For each line, the projected final cost, also called the forecast or estimate at completion (EAC), is cost to date plus cost to complete. The projected over or under is the current budget minus the projected final cost. These two columns are what management reads first.
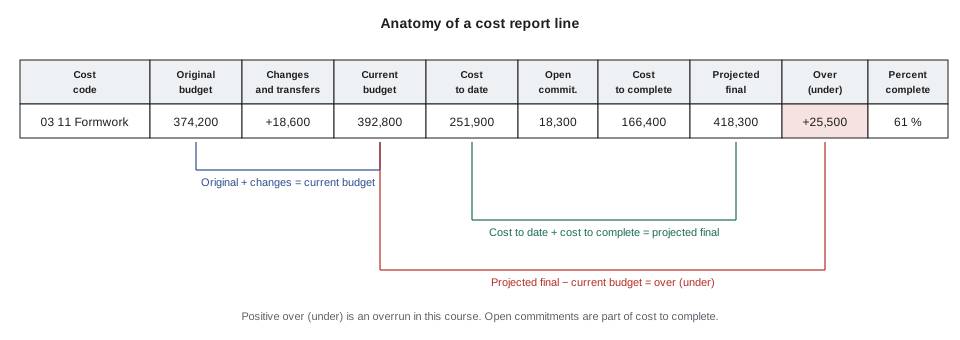
Sign conventions vary between companies: some show a projected overrun as positive, others as negative, and some use the label 'gain (loss)'. The important thing is that the report states its convention clearly and every reader knows it. This course shows projected over (under) budget, so a positive number is an overrun.
The cost report columns
Most construction cost reports, whatever software produces them, share a common set of columns. Reading across a line tells the story of that piece of work.
| Column | Meaning |
|---|---|
| Original budget | The budget at set-up (Lesson 2) |
| Changes and transfers | Approved change orders, buyout adjustments and budget transfers |
| Current budget | Original budget plus changes and transfers |
| Cost to date | Actual cost including accruals (Lesson 5) |
| Committed cost and open commitment | Total commitments and the part not yet billed |
| Cost to complete | Forecast of remaining cost |
| Projected final cost | Cost to date plus cost to complete |
| Projected over (under) | Projected final minus current budget |
| Percent complete | Measured physical progress (Lesson 4) |
| Previous projected over (under) | Last month's figure, to show the change |
# A simplified cost report for Riverbend Commons, end of month 8 (amounts $)
rows = [  # code, current budget, cost to date, cost to complete, previous projected over(under)
    ("03 11 Formwork (self-performed)",   392_800, 251_900, 166_400,  19_500),
    ("03 31 Concrete supply and place",   931_000, 640_200, 301_300,   6_000),
    ("06 10 Rough carpentry",             196_800,  41_300, 158_900,       0),
    ("07 50 Roofing (subcontract)",       633_400,       0, 633_400,       0),
    ("09 21 Drywall (subcontract)",     1_371_500,  88_000, 1_299_900, 12_400),
    ("23 00 Mechanical (subcontract)",  2_212_000, 690_000, 1_548_000,       0),
    ("01 50 General conditions",        1_904_000, 978_000, 958_000,  21_000),
    ("Contingency",                       271_100,       0, 205_000, -66_100),
]
tot = [0, 0, 0, 0, 0]
print(f"{'Line':<34}{'Budget':>11}{'To date':>11}{'To go':>11}{'Final':>11}{'Over':>9}{'Change':>8}")
for code, bud, ctd, ctc, prev in rows:
    final = ctd + ctc; over = final - bud
    print(f"{code:<34}{bud:>11,}{ctd:>11,}{ctc:>11,}{final:>11,}{over:>9,}{over - prev:>8,}")
    for i, v in enumerate((bud, ctd, ctc, final, over)): tot[i] += v
print(f"{'Total':<34}{tot[0]:>11,}{tot[1]:>11,}{tot[2]:>11,}{tot[3]:>11,}{tot[4]:>9,}")Line Budget To date To go Final Over Change 03 11 Formwork (self-performed) 392,800 251,900 166,400 418,300 25,500 6,000 03 31 Concrete supply and place 931,000 640,200 301,300 941,500 10,500 4,500 06 10 Rough carpentry 196,800 41,300 158,900 200,200 3,400 3,400 07 50 Roofing (subcontract) 633,400 0 633,400 633,400 0 0 09 21 Drywall (subcontract) 1,371,500 88,000 1,299,900 1,387,900 16,400 4,000 23 00 Mechanical (subcontract) 2,212,000 690,000 1,548,000 2,238,000 26,000 26,000 01 50 General conditions 1,904,000 978,000 958,000 1,936,000 32,000 11,000 Contingency 271,100 0 205,000 205,000 -66,100 0 Total 7,912,600 2,689,400 5,270,900 7,960,300 47,700
Several things stand out. Formwork is projected $25,500 over, up $6,000 from last month, so the trend is worsening. Drywall shows a $16,400 overrun before the subcontractor has done much work, which points to a pending change or a scope gap found at buyout. General conditions are $32,000 over and growing, which usually means the schedule is slipping. Against these, the contingency line forecasts using only $205,000 of its $271,100, so it offsets part of the overruns elsewhere: in effect, the report says that $66,100 of contingency is no longer needed for the risks that remain and is available to absorb the overruns that have already occurred.
How contingency appears in the report is a matter of company policy. Some contractors show contingency's cost to complete as the amount expected to be needed for remaining risks, so that the total projected over (under) is the net expected result. Others leave contingency at its full value until it is formally transferred. Either is acceptable if it is consistent and explained.
Lines with no commitments yet
Lines that have not been bought out, such as a landscaping package to be let in month 12, are forecast at their current budget unless there is better information: a budget price, market feedback or a re-estimate. Leaving them at budget is not neutral; it is an assumption that the package will be bought for exactly what was carried. If the market has moved since the bid, the forecast should say so. Unbought packages are a common source of late surprises, so a report that lists them separately, with the basis of each forecast, is easier to trust.
General conditions and time
General conditions are forecast mainly by time. If the forecast completion date moves, so does the cost to complete. A simple and robust method is to list each general conditions item with its monthly rate and the months remaining at the current forecast completion date. Lesson 8 shows how earned schedule can give an independent check on the completion date the team is using.
Worked problem
Forecasting general conditions
General conditions have cost $978,000 in 8 months. Remaining items cost an average of $119,000 per month, falling to $70,000 per month in the last two months when the crane and hoist are gone. The forecast completion is month 17 instead of the planned month 16. What is the cost to complete?
Show solution
- Remaining months: 9 (months 9 to 17).
- Seven months at $119,000 = $833,000.
- Two months at $70,000 = $140,000.
- Cost to complete: 833,000 + 140,000 = $973,000.
Answer: Cost to complete is about $973,000, giving a projected final of $1,951,000 against a budget of $1,904,000: $47,000 over, mostly because of the one-month extension.
The monthly cost review
The cost report becomes useful only when people review it. A good monthly cost review is short, structured and focused on change. The project manager presents the report, explains every line whose projected over (under) changed by more than a set threshold since last month, and describes what is being done about each. The operations manager or a peer project manager challenges the forecasts. The review closes with a list of actions, owners and dates.
| Review question | Why it matters |
|---|---|
| What changed since last month, and why? | Trends reveal problems sooner than totals |
| Are cost-to-complete figures based on current performance or hope? | Optimistic forecasts delay action |
| What risks remain, and is the contingency left enough to cover them? | Matches remaining cover to remaining risk |
| Which packages are not yet bought out, and what is the market saying? | Unbought scope is a common late surprise |
| Are pending changes priced and submitted? | Unrecovered changes erode the margin (Lesson 10) |
| Is the forecast completion date realistic? | Time drives general conditions and equipment |
Forecast quality
A forecast is good if it turns out to be close to the final result early in the job, and if it moves steadily rather than in sudden jumps. Contractors that track how their forecasts change month by month learn which project managers forecast realistically and which forecast optimistically and then take large write-downs near the end. A pattern of small monthly increases in projected cost on most lines is the classic sign of optimism; a well-run job shows forecasts that settle early and stay close.
# Forecast drift: projected final cost of formwork by month (amounts $)
budget = 392_800
forecast = [392_800, 395_000, 398_400, 402_500, 405_900, 410_400, 412_300, 418_300]
for m, f in enumerate(forecast, start=1):
    print(f"Month {m}: projected final {f:,}  over {f - budget:>7,}")
steps = [b - a for a, b in zip(forecast, forecast[1:])]
print("Monthly increases:", steps)
print("Every month worse:", all(s > 0 for s in steps))Month 1: projected final 392,800 over 0 Month 2: projected final 395,000 over 2,200 Month 3: projected final 398,400 over 5,600 Month 4: projected final 402,500 over 9,700 Month 5: projected final 405,900 over 13,100 Month 6: projected final 410,400 over 17,600 Month 7: projected final 412,300 over 19,500 Month 8: projected final 418,300 over 25,500 Monthly increases: [2200, 3400, 4100, 3400, 4500, 1900, 6000] Every month worse: True
A forecast that worsens every month, as here, means the team is forecasting from hope and adjusting only when costs arrive. A better forecast in month 3 would have projected the full overrun from the productivity trend.
Common mistakes
MistakeReporting actual cost without commitments.
InsteadTrack committed cost and open commitments so overruns are visible at award.
MistakeForecasting every line as remaining budget.
InsteadUse commitment-based, performance-based, bottom-up or time-based forecasts to suit each line.
MistakeLeaving unbought packages at budget without checking the market.
InsteadList them separately with the basis of each forecast.
MistakeForecasting general conditions without the latest completion date.
InsteadMultiply monthly rates by the months remaining at the current forecast date.
MistakePresenting totals only at the cost review.
InsteadExplain every line whose forecast changed beyond a threshold since last month.
MistakeRaising the forecast a little every month as costs arrive.
InsteadForecast from current performance and known risks so the forecast settles early.
Summary and key terms
- Commitments are contractual obligations to spend; open commitment is committed cost not yet billed.
- Cost to complete is a forecast made by commitment, performance, bottom-up or time-based methods.
- Projected final cost equals cost to date plus cost to complete; projected over (under) compares it with current budget.
- Standard report columns trace each line from original budget to projected over (under).
- Contingency treatment and sign conventions must be stated and consistent.
- General conditions are forecast from monthly rates and the current forecast completion date.
- The monthly review should focus on changes since last month, realistic forecasts and actions.
- Commitment
- A contractual obligation to spend, such as a subcontract or purchase order.
- Committed cost
- The total value of commitments on a line, including approved changes.
- Open commitment
- Committed cost not yet billed or invoiced.
- Cost to complete
- The forecast cost of the remaining work on a line; also called estimate to complete.
- Projected final cost
- Cost to date plus cost to complete; also called estimate at completion.
- Projected over (under)
- Projected final cost minus current budget.
- Back-charge
- A deduction from a vendor for work the contractor did on its behalf.
- Unbought package
- Scope not yet awarded to a subcontractor or supplier.
- Cost review
- The monthly meeting where forecasts are explained, challenged and acted on.
- Forecast drift
- A pattern of repeated small increases in projected cost.
Practice problems
Work each problem on paper first, then reveal the answer to check.
A subcontract is $840,000 with approved changes of $36,000; $512,000 has been billed. What is the open commitment?
Show answer
876,000 − 512,000 = $364,000.
Why do commitments give earlier warning than actual cost?
Show answer
An overrun is known when the subcontract or order is awarded, before any invoice.
Name four ways of forecasting cost to complete.
Show answer
Commitment-based, performance-based, bottom-up re-estimate, time-based.
Remaining budget hours are 400 and the expected PF is 0.80. What are the forecast remaining hours?
Show answer
500 hours.
Cost to date is $210,000 and cost to complete $95,000. Budget is $290,000. What is the projected over (under)?
Show answer
Projected final $305,000; $15,000 over.
What should be done with a package not yet bought out?
Show answer
Forecast it from the best available information and list the basis separately.
General conditions run $90,000 per month. The completion date slips two months. What is the added cost?
Show answer
About $180,000.
Name three questions for a monthly cost review.
Show answer
What changed and why, are forecasts realistic, is contingency enough, what is unbought, are changes submitted, is the date realistic.
What does a forecast that worsens slightly every month suggest?
Show answer
The team is forecasting from hope and reacting to costs as they arrive.
Why must the report state its sign convention?
Show answer
Companies differ; readers may misread overruns as savings.
Lesson quiz · 5 questions
Score 60% or more to complete this lesson.
Create a free account to save your progress, take quizzes and earn a certificate.