
CMPUT-499 · Lesson 7 of 12 · 27 min
Iterative development: sprints, estimation and working as a team
From week 6 to week 12, Team Relay works in four sprints of roughly two weeks. Each sprint starts with planning, runs with short daily coordination, and ends with a demonstration to the client and a retrospective. CMPUT-301 introduced process models and Scrum; CMPUT-401 covered running a product team, forecasting and release management. This lesson is about what changes when the team is five students with other courses, part-time availability, no manager and a fixed end date, and about the human side of the work: estimation, conflict, fairness and keeping going when the middle of the term gets hard.
Iteration works because it limits the cost of being wrong. Every two weeks the client sees working software and can say 'that is not what I meant' while it is still cheap to change. Every two weeks the team looks at how it worked and adjusts. A capstone team that saves everything for the final week gets one chance to be right; a team that demos every sprint gets four or five, and arrives at the final demonstration with a product the client has already shaped.
The sprint cycle
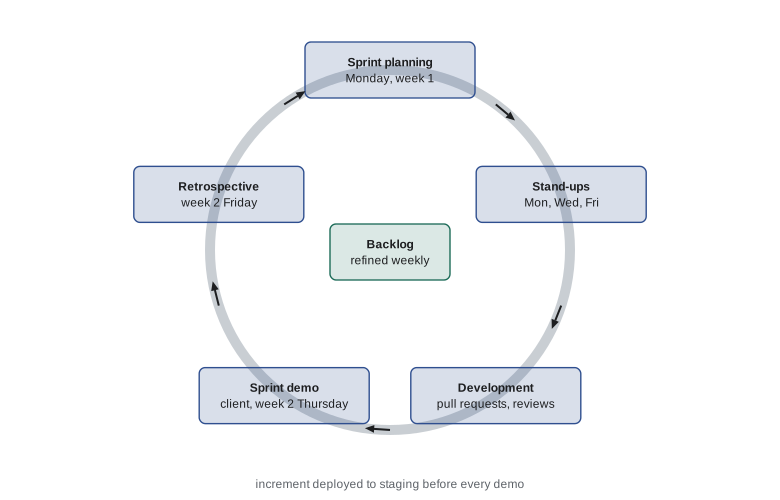
Sprint planning takes about an hour at the start of each sprint. The product lead brings a prioritized backlog, refined in the previous week so that the top items have clear acceptance criteria and estimates. The team agrees a sprint goal in one sentence, such as 'drivers get reminders and can confirm or cancel', selects the stories that serve it, and checks the total against its recent velocity, the number of story points it actually completed in past sprints. Members then pull tasks; nobody assigns work to others. The goal matters more than the list: if a story turns out bigger than expected, the team can drop a lower-priority one and still meet the goal.
Stand-ups keep the team coordinated without long meetings. Team Relay met for 15 minutes on Monday, Wednesday and Friday mornings, in person or by video, and each person said what they had finished, what they would do next and what was blocking them. Blockers get resolved after the stand-up by the people involved, not discussed by all five. On the other days they posted the same three lines in the team channel. Daily stand-ups suit full-time teams; three a week is usually right for students, and an asynchronous update is better than a meeting nobody attends.
The sprint demo is the most important meeting of the sprint. The team shows working software on the staging environment, not slides, to the client, walking through each completed story against its acceptance criteria. The client tries it themselves where possible. Record feedback as new backlog items rather than promising changes on the spot. Team Relay rotated presenters, kept demos to 30 minutes and always ended by showing the next sprint's plan and asking the client to confirm its priorities. Grace said later that the demos were where she started to trust the team, because she saw progress every two weeks.
Estimation and velocity
Teams estimate stories in story points, a relative measure of size and uncertainty, rather than in hours. A common scale uses Fibonacci-like numbers, 1, 2, 3, 5, 8 and 13, and stories above 8 are split. Points are relative to the team: Team Relay used the driver sign-in story as their reference 3. Planning poker, where everyone reveals an estimate at once and the highest and lowest explain their reasoning, surfaces hidden assumptions. When Marcus estimated the reminder story at 3 and Ethan at 8, the discussion revealed that Ethan was counting the work to handle text replies such as CANCEL, which Marcus had not considered. They split it into two stories.
Velocity is the number of points completed per sprint, counting only stories that meet the definition of done. It is a planning tool, not a performance score: a team that inflates estimates to look faster only damages its own forecasts. Velocity is noisy in the first sprints, because a team is still setting up and learning. Team Relay completed 14 points in sprint 1 and 19 in sprint 2. Rather than plan with the average, they used a Monte Carlo forecast, resampling past velocities to estimate the probability of finishing the remaining backlog in a given number of sprints, as CMPUT-401 showed.
# Release forecast by Monte Carlo, run after sprint 2: resample past velocities,
# allow +/-20% noise, and remember that sprint 4 is planned at half capacity.
import random
random.seed(499)
velocities = [14, 19]              # story points completed in sprints 1 and 2
trials = 20000
def finishes(points):
    ok = 0
    for _ in range(trials):
        s3 = random.choice(velocities) * random.uniform(0.8, 1.2)
        s4 = 0.5 * random.choice(velocities) * random.uniform(0.8, 1.2)   # hardening sprint
        ok += (s3 + s4) >= points
    return 100 * ok / trials
scopes = [("remaining MVP", 22),
          ("MVP + texts to stores", 26),
          ("MVP + texts + shift swaps", 32)]
for name, pts in scopes:
print(f"{name:28} {pts:3} points: {finishes(pts):5.1f}% chance of finishing by the end of sprint 4")remaining MVP 22 points: 76.5% chance of finishing by the end of sprint 4 MVP + texts to stores 26 points: 35.9% chance of finishing by the end of sprint 4 MVP + texts + shift swaps 32 points: 2.0% chance of finishing by the end of sprint 4
The forecast, run after sprint 2, told the team something uncomfortable but useful. The remaining MVP was likely to fit, at about three chances in four. Adding texts to stores made it worse than even, and adding shift swaps as well was very unlikely. Priya took the forecast to the client meeting and asked Grace to rank the remaining stories. Grace chose the coordinator dashboard and the funders' report over shift swaps and texts to stores, and the team started the dashboard early in sprint 3. Forecasts with probabilities make these conversations honest; a single date makes them a negotiation. In the event the team completed 17 points in sprint 3 and finished the MVP in sprint 4.
Tracking progress within a sprint
A burndown chart shows the points remaining in the sprint at the end of each day against an ideal straight line from the commitment to zero. Its main use is as an early warning. A burndown that stays flat for several days means stories are in progress but not finishing, often because they are too large, blocked on review, or waiting for an answer from the client. Look at the shape, not the exact numbers. Sprint 2's burndown below was flat early, because the reminder story was blocked on a question about consent for text messages, and steep at the end. Two points carried over, which the team discussed at the retrospective.
# Sprint 2 burndown: points remaining at the end of each working day versus the ideal line.
committed = 20
remaining = [20, 20, 18, 18, 15, 13, 13, 8, 5, 2]     # end of day 1..10
for day, left in enumerate(remaining, start=1):
    ideal = committed * (1 - day / len(remaining))
    bar = "#" * left
    flag = "  behind" if left > ideal + 3 else ""
    print(f"day {day:2}: {left:2} left  ideal {ideal:4.1f}  {bar}{flag}")
print(f"completed {committed - remaining[-1]} of {committed} points; carried over {remaining[-1]}")day 1: 20 left ideal 18.0 #################### day 2: 20 left ideal 16.0 #################### behind day 3: 18 left ideal 14.0 ################## behind day 4: 18 left ideal 12.0 ################## behind day 5: 15 left ideal 10.0 ############### behind day 6: 13 left ideal 8.0 ############# behind day 7: 13 left ideal 6.0 ############# behind day 8: 8 left ideal 4.0 ######## behind day 9: 5 left ideal 2.0 ##### day 10: 2 left ideal 0.0 ## completed 18 of 20 points; carried over 2
Limit work in progress. Five people each starting a different story on the first day produces five half-finished stories on the last day. A better pattern is to finish stories before starting new ones, to swarm on blocked work, and to treat waiting pull requests as more urgent than new code. Team Relay set a soft limit of one story in progress per person plus reviews, and after sprint 2 added a rule that any story blocked for more than a day goes to the next stand-up as a problem to solve, not a status to report.
Retrospectives
The retrospective closes each sprint. The team reflects on how it worked, not on what it built, and chooses one or two concrete changes for the next sprint. A simple format is three questions: what went well, what did not, and what will we change. Keep it blameless: discuss events and systems, not personal faults. Write down the actions with owners and check them at the next retrospective. Team Relay's actions included moving the stand-up time, prioritizing reviews over new work, writing acceptance criteria before estimating rather than after, and asking the client for a two-day maximum on answers to blocking questions.
Retrospectives only work if people speak honestly, which is hard among classmates. Rotate the facilitator, collect points anonymously in a shared document first if the team is reluctant, and make it normal to raise small problems before they become large ones. If the same problem appears in two retrospectives in a row, the action from the first one did not work; try something different or ask the supervisor for help. A team that holds retrospectives every sprint and changes something each time improves visibly by the end of term.
Team dynamics and conflict
Most capstone teams have at least one serious disagreement during the term, and that is normal. Healthy conflict is about ideas: which framework, which feature first, how to structure a module. It improves decisions when handled respectfully. Unhealthy conflict becomes personal or turns into avoidance. The charter from lesson 1 gives the escalation path: raise it directly and privately first, then at the retrospective, then with the supervisor. Disagree about technical choices with evidence, a quick spike or an ADR, and once a decision is made by the agreed process, commit to it even if it was not your preference.
Common patterns have known remedies. A member who disappears for a week usually has a reason, such as illness, a family matter or an overloaded term; reach out privately and kindly before assuming bad faith, and tell the supervisor early if it continues. A member who does too much, rewriting others' code at night, creates fragile knowledge silos and resentment; ask them to pair and review instead. Differences in experience are normal; pair a less experienced member with a stronger one on real stories rather than giving them only documentation or testing. And watch for patterns where some voices, often those of women or students from under-represented groups, are interrupted or credited less; the facilitator's job includes making sure everyone is heard.
Equitable contribution and peer evaluation
Fairness matters to students and to assessment. Most capstone courses combine three sources of evidence about individual contribution: peer evaluation, where each member rates themselves and their teammates, repository data, and the supervisor's observations at meetings and demos. Each is imperfect. Peer ratings can reflect friendships; repository data can mislead; supervisors see only part of the work. Together they are reasonably reliable. Lesson 12 shows how peer ratings adjust individual marks; here we look at repository data and its traps.
# Contribution analysis from a (synthetic) git log, with the caveats that matter.
# Each record: author, commits, lines added, lines deleted, reviews given, issues closed.
records = {
    "Priya":  dict(commits=48,  added=2900,  deleted=900,  reviews=41, issues=19, docs_pages=14),
    "Marcus": dict(commits=131, added=11800, deleted=4200, reviews=57, issues=34, docs_pages=6),
    "Sofia":  dict(commits=97,  added=7300,  deleted=3100, reviews=49, issues=28, docs_pages=5),
    "Ethan":  dict(commits=36,  added=9400,  deleted=600,  reviews=12, issues=11, docs_pages=3),
    "Lin":    dict(commits=88,  added=5200,  deleted=1900, reviews=63, issues=25, docs_pages=21),
}
team = {k: sum(r[k] for r in records.values()) for k in next(iter(records.values()))}
print(f"{'':7}" + "".join(f"{k:>11}" for k in team))
for name, r in records.items():
    print(f"{name:7}" + "".join(f"{100 * r[k] / team[k]:10.0f}%" for k in team))
# Caveat check: a large share of lines from few commits often means generated or vendored code.
for name, r in records.items():
    lines_per_commit = r["added"] / r["commits"]
    if lines_per_commit > 150:
print(f"note: {name} averages {lines_per_commit:.0f} added lines per commit - check for generated files")commits added deleted reviews issues docs_pages Priya 12% 8% 8% 18% 16% 29% Marcus 33% 32% 39% 26% 29% 12% Sofia 24% 20% 29% 22% 24% 10% Ethan 9% 26% 6% 5% 9% 6% Lin 22% 14% 18% 28% 21% 43% note: Ethan averages 261 added lines per commit - check for generated files
Repository statistics must be read with care. Ethan's share of added lines looks large because his commits included a generated lock file and database migration snapshots; his real contribution was the pipeline and environments, which show up as few commits and many unblocked teammates. Priya's code share is small because she spent much of her time on discovery, client communication, backlog refinement and the proposal, which leave little trace in Git. Lin did the most reviewing and documentation. Lines of code measure typing, not value. Use the data to start a conversation, not to end one, and make invisible work visible by linking it to issues, meeting notes and documents.
Keeping going
The middle of the term is the hardest part. The novelty has worn off, midterms arrive in other courses, the remaining work is the tedious part, and the end feels far away. Sustainable pace matters more than heroics: all-night sessions before a demo produce bugs and resentment. Protect the team's capacity by keeping the sprint commitment realistic, cutting scope rather than working longer when the forecast says so, and celebrating finished stories. Team Relay held a ten-minute 'demo to ourselves' before each client demo and kept a list of finished stories visible on their board, which made progress feel real in weeks when it felt slow.
Worked examples
Worked problem
Planning a sprint
Velocities so far are 14, 19 and 17. The top backlog stories are 5, 5, 3, 3, 5 and 8 points. What should the team commit to?
Show solution
- The average is about 17; the worst sprint was 14.
- A cautious commitment sits between the worst and the average: about 15 to 16 points.
- Taking stories in priority order: \(5 + 5 + 3 + 3 = 16\). Adding the next 5 would make 21, above even the best sprint.
Answer: Commit to the first four stories, 16 points, with the next story as a stretch if work goes well.
Worked problem
Reading a burndown
A burndown is flat for days 2 to 6 and then drops steeply. What are likely causes?
Show solution
- Flat means no story met the definition of done for several days.
- Typical causes: stories too large, work blocked on reviews or client answers, or everyone working in parallel on different stories.
- The steep drop at the end means many stories finished at once, often with rushed reviews.
Answer: Large or blocked stories and too much work in progress; split stories, swarm on blockers and prioritize reviews.
Worked problem
Interpreting line counts
One member has 40 per cent of added lines but only 12 per cent of commits. What should the team check before concluding anything?
Show solution
- Compute lines per commit: a high value suggests large generated, vendored or formatting changes.
- Look at what the commits contain: lock files, snapshots or moved files inflate line counts.
- Consider work outside Git, such as infrastructure set up in consoles, design or client work.
Answer: Check for generated files and invisible work; line counts alone do not measure contribution.
Common mistakes
MistakeTreat velocity as a measure of how hard people work.
InsteadUse it only for planning; inflating it damages forecasts.
MistakePlan each sprint with the best velocity so far.
InsteadPlan between the worst and the average, with a stretch item.
MistakePromise changes during the client demo.
InsteadRecord feedback as backlog items and prioritize them with the client.
MistakeSkip retrospectives when the team is busy.
InsteadHold a short one every sprint and choose one concrete change.
MistakeJudge contribution by lines of code.
InsteadCombine peer evaluation, repository data read with care and supervisor observation.
Summary and key terms
- Sprints limit the cost of being wrong by putting working software in front of the client every two weeks.
- Planning sets a one-sentence goal and selects stories against realistic velocity.
- Stand-ups coordinate; three a week plus async updates suits student teams.
- Story points are relative; velocity is for forecasting, best done with probabilities.
- Burndowns warn of large or blocked work; limit work in progress and prioritize reviews.
- Blameless retrospectives produce concrete changes that are checked next sprint.
- Contribution evidence combines peer ratings, repository data and supervisor observation; lines of code mislead.
- Sprint goal
- A one-sentence statement of what a sprint should achieve.
- Story point
- A relative unit of size and uncertainty for estimating backlog items.
- Velocity
- Story points completed per sprint, counting only work that meets the definition of done.
- Planning poker
- An estimation technique where everyone reveals an estimate at once and outliers explain.
- Burndown chart
- A chart of work remaining in a sprint against an ideal line.
- Work in progress limit
- A cap on how many items a team or person works on at once.
- Retrospective
- A meeting at the end of a sprint to improve how the team works.
- Peer evaluation
- Team members' ratings of each other's contributions, used in assessment.
Practice problems
Work each problem on paper first, then reveal the answer to check.
Write a sprint goal for a sprint that delivers the funders' report.
Show answer
For example: "The director can see and download monthly kg rescued by donor and agency."
Two estimates for a story are 2 and 8. What should happen next?
Show answer
The two estimators explain their reasoning; the team discusses assumptions and re-estimates or splits the story.
Name two reasons a burndown might stay flat.
Show answer
Stories are too large, or work is blocked on reviews or client answers.
Give a retrospective action that is concrete.
Show answer
For example, "reviews before new work; first review within one working day; owner Lin."
Why is work done in client meetings hard to see in Git?
Show answer
Discovery, communication and planning produce documents and decisions, not commits; link them to issues and notes.
Lesson quiz · 5 questions
Score 60% or more to complete this lesson.
Create a free account to save your progress, take quizzes and earn a certificate.