
CMPUT-499 · Lesson 2 of 12 · 30 min
Finding the problem: client discovery and success metrics
Most failed software projects did not fail because the code was bad. They failed because the team built something nobody needed, or solved the problem the client described in the first meeting rather than the problem the client actually had. Discovery is the work of finding out what the real problem is, who has it, how they cope today and what would count as success. CMPUT-401 covered product discovery and CMPUT-421 covered user research methods in depth; this lesson applies them to a capstone, where you have about two weeks, a client who is not a product manager and users who have never been interviewed before.
Clients usually arrive with a solution in mind. Grace's first email to the course said: 'We need an app for our drivers.' That is a solution, not a problem. An app might be right, but so might a better spreadsheet, a text-message reminder service, or a change in how shifts are offered. The team's job in discovery is to understand the situation well enough to judge which solution fits, and to bring evidence for that judgment back to the client. Treat the client's proposed solution as a hypothesis to test, politely, not as a requirement.
Who are the stakeholders?
Start by listing everyone who affects or is affected by the problem. For the co-op, that list is longer than Grace alone. Volunteer drivers do the pickups and are the main users of any scheduling tool. Donors, such as grocery store managers and bakery owners, hand over food and care about predictable pickup times. Recipient agencies, such as shelters and community kitchens, care about knowing what will arrive and when. The executive director cares about cost, funder reports and whether the tool will still work next year. The co-op's board approves spending. And the people who eat the food never touch the software but are the reason it matters.
| Stakeholder | Interest | Influence on the project | How Team Relay engaged them |
|---|---|---|---|
| Volunteer coordinator (Grace) | Less scheduling work; fewer missed pickups | High: day-to-day client contact | Fortnightly meetings, two interviews, observed a scheduling morning |
| Executive director (Sam) | Cost, funder reporting, sustainability | High: signs the agreement | One interview, proposal review |
| Volunteer drivers | Easy sign-up, shift swaps, clear instructions | Medium: adoption depends on them | Three interviews, one ride-along, survey of 41 drivers |
| Donor store managers | Predictable pickup times, a contact person | Medium | Two interviews |
| Recipient agency cooks | Know what is coming and when | Low to medium | One interview |
| Co-op board | Risk, cost, privacy | High at decision points | Briefed through the director |
Rank stakeholders by interest and influence, as CMPUT-401 showed, and plan how much time each deserves. The volunteer coordinator and the drivers get the most attention, because they will use the system every day and the project fails if they do not adopt it. The board gets a short briefing at the proposal stage. Do not skip the low-influence groups: the shelter cook's complaint that 'food sits on the loading dock because nobody tells us it is coming' turned out to be one of the most useful findings of the whole discovery phase.
Interviews, observation and surveys
Interviews are the core discovery method. Aim for five to eight short interviews across the main stakeholder groups, each 30 to 45 minutes, with two team members present: one asks questions and one takes notes. Ask about past behaviour, not hypothetical futures. 'Tell me about the last time a pickup went wrong' produces specific, honest stories; 'Would you use an app that…?' produces polite yeses that predict nothing. Follow interesting answers with 'Why?' and 'What happened next?', and resist the urge to pitch your solution. If you hear yourself explaining your idea, stop and ask another question.
Observation catches what people do not think to mention. Two members of Team Relay sat with Grace for a Tuesday morning while she scheduled the week. They counted 23 phone calls and texts in three hours, watched her keep three spreadsheet tabs and a paper notebook in sync, and saw that she kept a private list of 'reliable drivers' she called first when a shift needed filling. None of this came up in her interview. One member also rode along on a pickup with a driver and discovered that stores often have no idea which volunteer is coming, so drivers waste time explaining who they are at the loading dock.
Surveys are useful for checking how widespread something is, once interviews have told you what to ask about. Team Relay sent a ten-question survey to the co-op's drivers through Grace and got 41 responses from about 140 drivers. Thirty-three used their phone to read the group chat while on shift, 29 said they would like to swap shifts with another driver without going through Grace, and 12 said they sometimes missed pickups because they misread the time in the chat. Surveys alone can mislead, because the people who answer are often the most engaged, but combined with interviews they help separate a widespread problem from one person's frustration.
Research with people raises ethical questions even in a student project. Tell participants who you are, what the research is for, that participation is voluntary and how their information will be used. Do not record without permission. Store notes without unnecessary personal details: 'Driver B, retired, drives on weekdays' is enough; a full name and phone number is not. Many universities require ethics approval for research intended for publication, but treat capstone discovery as part of a client service project rather than research; ask your supervisor what your institution requires, and follow the research ethics principles from CMPUT-421 either way.
Making sense of what you heard
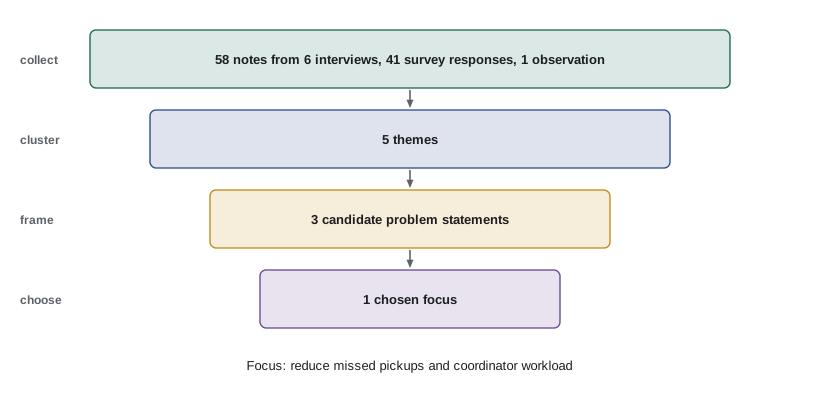
After the interviews you will have pages of notes and a strong temptation to start building whatever the loudest person asked for. Synthesis turns notes into findings. The simplest reliable method is affinity mapping: write each observation on its own note, cluster similar notes, name each cluster as a theme, and count how many notes and how many different people support each theme. A theme mentioned by five different stakeholders is stronger evidence than one mentioned five times by the same person. Look for surprises and contradictions as well as agreement, because they often point to the real problem.
# Affinity mapping: Team Relay coded 58 notes from six interviews with tags,
# then counted how often each theme came up and from how many different people.
notes = [
    ("Grace", "late cancel"), ("Grace", "phone tag"), ("Grace", "spreadsheet errors"),
    ("Grace", "late cancel"), ("Grace", "no-show"), ("Grace", "reporting to funders"),
    ("Grace", "phone tag"), ("Grace", "new volunteer onboarding"), ("Grace", "spreadsheet errors"),
    ("Grace", "late cancel"), ("Grace", "who has a fridge van"),
    ("Driver A", "late cancel"), ("Driver A", "unclear pickup time"), ("Driver A", "phone tag"),
    ("Driver A", "parking at store"), ("Driver A", "want to swap shifts"), ("Driver A", "unclear pickup time"),
    ("Driver A", "group chat noise"), ("Driver A", "want to swap shifts"), ("Driver A", "mobile use"),
    ("Driver B", "group chat noise"), ("Driver B", "want to swap shifts"), ("Driver B", "mobile use"),
    ("Driver B", "unclear pickup time"), ("Driver B", "no-show"), ("Driver B", "mobile use"),
    ("Driver B", "who has a fridge van"), ("Driver B", "parking at store"), ("Driver B", "language"),
    ("Store manager", "unclear pickup time"), ("Store manager", "no-show"), ("Store manager", "no-show"),
    ("Store manager", "food sits on dock"), ("Store manager", "contact person"), ("Store manager", "food sits on dock"),
    ("Store manager", "receipts for donations"), ("Store manager", "unclear pickup time"), ("Store manager", "contact person"),
    ("Shelter cook", "unclear delivery time"), ("Shelter cook", "food sits on dock"), ("Shelter cook", "unclear delivery time"),
    ("Shelter cook", "what is coming"), ("Shelter cook", "what is coming"), ("Shelter cook", "allergen info"),
    ("Shelter cook", "no-show"), ("Shelter cook", "what is coming"), ("Shelter cook", "contact person"),
    ("Director", "reporting to funders"), ("Director", "reporting to funders"), ("Director", "volunteer retention"),
    ("Director", "cost"), ("Director", "cost"), ("Director", "privacy of volunteers"), ("Director", "volunteer retention"),
    ("Director", "who maintains it"), ("Director", "who maintains it"), ("Director", "late cancel"), ("Director", "cost"),
]
themes = {
    "Missed pickups (late cancel, no-show)": {"late cancel", "no-show"},
    "Unclear times and handoffs": {"unclear pickup time", "unclear delivery time", "food sits on dock", "contact person", "what is coming"},
    "Coordination overhead": {"phone tag", "spreadsheet errors", "group chat noise", "want to swap shifts"},
    "Reporting and funding": {"reporting to funders", "receipts for donations"},
    "Sustainability of the tool": {"cost", "who maintains it"},
}
print(f"notes: {len(notes)} from {len({p for p, _ in notes})} people")
rows = []
for theme, tags in themes.items():
    hits = [(p, t) for p, t in notes if t in tags]
    people = sorted({p for p, _ in hits})
    rows.append((len(people), len(hits), theme, people))
for n_people, n_notes, theme, people in sorted(rows, reverse=True):
    print(f"{theme:40} {n_notes:2} notes, {n_people} of 6 people: {', '.join(people)}")
coded = set().union(*themes.values())
left = sorted({t for _, t in notes if t not in coded})
print("tags not yet in a theme:", left)notes: 58 from 6 people Missed pickups (late cancel, no-show) 10 notes, 6 of 6 people: Director, Driver A, Driver B, Grace, Shelter cook, Store manager Unclear times and handoffs 16 notes, 4 of 6 people: Driver A, Driver B, Shelter cook, Store manager Coordination overhead 10 notes, 3 of 6 people: Driver A, Driver B, Grace Reporting and funding 4 notes, 3 of 6 people: Director, Grace, Store manager Sustainability of the tool 5 notes, 1 of 6 people: Director tags not yet in a theme: ['allergen info', 'language', 'mobile use', 'new volunteer onboarding', 'parking at store', 'privacy of volunteers', 'volunteer retention', 'who has a fridge van']
The counts changed the team's picture of the project. Missed pickups were the most widely felt problem, raised by all six people interviewed. But the second theme, unclear times and handoffs, came from drivers, store managers and the shelter cook, not from Grace, who had not mentioned it. Coordination overhead was Grace's biggest personal pain and the reason she had contacted the course. And the director's concerns about cost and maintenance, raised by only one person, were a constraint on any solution rather than a feature request: whatever the team built had to cost almost nothing to run and be maintainable by a volunteer with modest technical skills.
Writing the problem statement
A problem statement says who has the problem, what the problem is, why it matters and how you will know it is solved, without naming a solution. A useful template is: 'Who needs a way to do what, because why, and today they cope by how.' Team Relay wrote three candidate statements from their themes and chose one with the client. The chosen statement was: 'The co-op's volunteer coordinator and drivers need a reliable way to fill, swap and confirm pickup shifts, because about one pickup in twelve is missed and the coordinator spends roughly 15 hours a week scheduling by phone and spreadsheet; today missed pickups are discovered only when a store or shelter calls.'
Look at what the statement leaves out. It does not say 'app', 'website' or 'mobile'. It does not mention donation receipts, route optimization or allergen tracking, which came up in interviews but were less widespread or less important. Those are not lost: they go into a list of future opportunities in the proposal. Choosing a narrow problem is the single most important scoping decision a capstone team makes. A team that tries to solve every problem it heard in discovery will solve none of them well in ten weeks of development.
Success metrics and a baseline
Success metrics turn the problem statement into numbers that the client cares about, measured before and after. Good capstone metrics are few, tied to the problem, measurable with data you can actually get and agreed with the client. Team Relay chose three: the percentage of scheduled pickups that are missed, the coordinator's weekly hours spent on scheduling, and the share of drivers who confirm their shift through the system rather than by phone. They also chose one guardrail metric, something that must not get worse: the number of active drivers, because a tool that annoyed volunteers into quitting would be worse than no tool at all.
A metric without a baseline is a wish. Before writing any code, Team Relay asked Grace for the last twelve weeks of the scheduling spreadsheet and computed the current values. This also tested whether the data existed in a usable form; it did, after an afternoon of cleaning inconsistent date formats. The program below reproduces the calculation on synthetic data shaped like the co-op's. The output shows about 8 per cent of pickups missed, roughly 290 kg of food a week not rescued, and about 14.5 hours of scheduling a week. The baseline lets the final report make an honest claim, and protects the team against two opposite errors: claiming success without evidence, and failing to notice a real improvement.
# Baseline metrics from the co-op's spreadsheet for 12 weeks before the project.
# Synthetic but realistic: each row is one scheduled pickup.
import random
random.seed(499)
weeks = 12
rows = []
for w in range(weeks):
    for _ in range(random.randint(55, 70)):                     # pickups scheduled per week
        late_cancel = random.random() < 0.09                     # driver cancels < 12 h before
        no_show = (not late_cancel) and random.random() < 0.04   # driver never arrives
        refilled = late_cancel and random.random() < 0.45        # coordinator finds a replacement
        kg = round(random.uniform(15, 90), 1)
        rows.append(dict(week=w, late_cancel=late_cancel, no_show=no_show, refilled=refilled, kg=kg))
scheduled = len(rows)
missed = [r for r in rows if r["no_show"] or (r["late_cancel"] and not r["refilled"])]
kg_lost = sum(r["kg"] for r in missed)
print(f"pickups scheduled: {scheduled} ({scheduled / weeks:.1f} per week)")
print(f"late cancellations: {sum(r['late_cancel'] for r in rows)}, refilled: {sum(r['refilled'] for r in rows)}")
print(f"missed pickups: {len(missed)} = {100 * len(missed) / scheduled:.1f}% of scheduled")
print(f"food not rescued: {kg_lost:,.0f} kg in {weeks} weeks (about {kg_lost / weeks:.0f} kg per week)")
coordinator_hours = [round(random.uniform(13, 17), 1) for _ in range(weeks)]
print(f"coordinator scheduling time: {sum(coordinator_hours) / weeks:.1f} hours per week (self-reported)")pickups scheduled: 743 (61.9 per week) late cancellations: 60, refilled: 23 missed pickups: 62 = 8.3% of scheduled food not rescued: 3,440 kg in 12 weeks (about 287 kg per week) coordinator scheduling time: 14.5 hours per week (self-reported)
Set targets with the client, and make them realistic for one term. A student team cannot run a year-long trial. Team Relay agreed to a four-week pilot at the end of term with 30 volunteer drivers, and targets of fewer missed pickups than the baseline, at least 60 per cent of shifts confirmed in the system, and coordinator scheduling time under 10 hours a week during the pilot. They agreed in writing that missing a target would not mean the project failed: the purpose of the pilot was to learn whether the approach worked and to give the co-op evidence for its own decision.
Assumptions and risky beliefs
Every plan rests on beliefs that might be false. Write them down and test the riskiest ones early. Team Relay listed beliefs such as 'drivers will use a web app on their phones', 'the co-op can host a small web application cheaply', 'Grace will trust automated reminders' and 'store managers will accept a text message saying who is coming'. The first was supported by the survey. The second was checked with Ethan's quick estimate of hosting costs. The third was tested with a paper prototype in week 3, where Grace walked through a mock reminder flow and asked for the ability to override any automatic message, which became a requirement. The fourth was left for the pilot.
Worked examples
Worked problem
Turning a solution into a problem
A client says: "We need a mobile app so drivers can see their shifts." Rewrite this as a question that opens discovery.
Show solution
- Identify the solution in the request: a mobile app.
- Ask what the app is supposed to change: why do drivers need to see shifts, and what goes wrong today?
- Phrase it around behaviour and outcomes: what happens when drivers do not know their shifts?
Answer: "Tell me about the last time a driver did not know about a shift. What happened, and what did it cost?" The app becomes one possible answer, not the starting point.
Worked problem
Weighing evidence
Theme A has 12 notes from 1 person. Theme B has 7 notes from 5 people. Which is stronger evidence of a widespread problem?
Show solution
- Count distinct people, not just notes: A comes from one person, B from five.
- Repetition by one person shows intensity, which still matters, but not breadth.
- Check whether that one person is a key user, such as the coordinator, before dismissing A.
Answer: Theme B shows a widespread problem; Theme A shows one person's strong pain, which may still matter if that person is central.
Worked problem
A guardrail metric
Why did Team Relay track the number of active drivers?
Show solution
- The main metrics reward fewer missed pickups and less coordinator time.
- A tool could improve those numbers by pushing away unreliable or less technical drivers.
- Tracking active drivers detects this harm, which the main metrics would hide.
Answer: It is a guardrail: improving the main metrics must not come at the cost of losing volunteers.
Common mistakes
MistakeTreat the client's first request as the requirement.
InsteadTreat it as a hypothesis; discover the problem behind it.
MistakeAsk "Would you use…?" in interviews.
InsteadAsk about specific past events: "Tell me about the last time…"
MistakeCount notes but not people when synthesizing.
InsteadCount distinct people too; breadth and intensity are different evidence.
MistakeWrite a problem statement that names a solution.
InsteadDescribe who, what, why and how they cope today, with no technology named.
MistakeSet success metrics without a baseline.
InsteadMeasure current values before building, using the client's real data.
Summary and key terms
- Discovery finds the real problem; the client's first request is a hypothesis.
- Map stakeholders by interest and influence, and include low-influence groups.
- Interview about past behaviour, observe real work and use surveys to check breadth.
- Affinity mapping clusters notes into themes, counted by notes and by distinct people.
- A problem statement names who, what, why and the current workaround, but no solution.
- Success metrics need a baseline, realistic targets for one term and a guardrail metric.
- List risky assumptions and test the riskiest early, for example with paper prototypes.
- Discovery
- Work to understand the real problem, its users and how they cope today, before building.
- Stakeholder
- Anyone who affects or is affected by the problem or the product.
- Affinity mapping
- Clustering individual research observations into named themes.
- Problem statement
- A description of who has a problem, what it is, why it matters and the current workaround.
- Baseline
- The value of a metric measured before a change, used for comparison.
- Guardrail metric
- A measure that must not get worse while the main metrics improve.
- Paper prototype
- A sketch-level mock-up used to test an idea with users before any code.
- Ride-along
- Observing a user doing their real work in its real setting.
Practice problems
Work each problem on paper first, then reveal the answer to check.
Write one interview question about past behaviour for a store manager.
Show answer
For example: "Tell me about the last pickup that went wrong. What happened?"
Name a stakeholder Team Relay might have missed, and why they matter.
Show answer
For example, the people who receive the food, or the co-op's board, which approves spending and cares about privacy risk.
Rewrite "Build a dashboard for funders" as a problem statement.
Show answer
For example: "The director needs to report rescued food to funders quarterly, because funding depends on it; today she compiles numbers by hand from spreadsheets."
Propose a guardrail metric for a feature that sends automatic reminder texts.
Show answer
For example, the opt-out rate for texts or the number of complaints, which must not rise.
Why compute the baseline before writing code?
Show answer
It tests that the data exists and gives a fair comparison for the end-of-term evaluation.
Lesson quiz · 5 questions
Score 60% or more to complete this lesson.
Create a free account to save your progress, take quizzes and earn a certificate.