
CIV-390 · Lesson 9 of 12 · 18 min
Vertical alignment
A short distance beyond the new curve, the Ridgeway Road extension climbs over a rail spur that serves the future industrial park and then drops to a creek crossing. The existing road humps over the tracks so abruptly that a driver approaching the crest cannot see a car stopped on the far side until it is too late to stop. This lesson covers the vertical alignment of roads: grades, the parabolic vertical curves that connect them, the length needed for sight distance on crests and for headlight distance on sags, the computation of elevations along a curve, and the coordination of vertical and horizontal alignment.
Grades
The profile of a road is a series of straight grades joined by vertical curves. Grades are expressed in percent, the rise per 100 units of horizontal distance, positive uphill in the direction of stationing. Maximum grades depend on the design speed, the terrain and the type of road: for a rural collector in rolling terrain at 80 km/h (50 mph), a maximum of about 6 to 7 % is typical, while freeways in flat country rarely exceed 3 to 4 %. Steep grades slow trucks, which lose speed on long upgrades and may need climbing lanes, and lengthen stopping distances on downgrades. They also matter in winter: a steep grade at a stop sign or signal is hard to climb from a stop on ice.
Minimum grades matter too. In curbed urban streets, the gutter needs a longitudinal grade of at least about 0.3 to 0.5 % for water to flow to the inlets, so even a flat street is given a gentle profile. On rural roads with open ditches, the ditches can be graded independently of the road. The critical length of grade is the length of upgrade on which a loaded truck slows by a set amount, often 15 km/h (10 mph); beyond it, a climbing lane is considered if truck volumes are significant.
The parabolic vertical curve
Vertical curves are parabolas, because a parabola has a constant rate of change of grade, which gives a uniform rate of change of vertical acceleration for drivers and simple computations for designers. A vertical curve joins an initial grade \(g_1\) to a final grade \(g_2\) over a horizontal length \(L\). Its key points are the beginning of the vertical curve (BVC), the point of vertical intersection (PVI) where the two grade lines meet, and the end of the vertical curve (EVC). The PVI lies at the midpoint of the curve's horizontal length. A crest curve has \(g_1 > g_2\); a sag curve has \(g_1 < g_2\). The algebraic difference in grades is \(A = |g_2 - g_1|\).
Measured from the BVC, the elevation at a horizontal distance \(x\) along the curve is
with grades in percent. The grade changes linearly along the curve, from \(g_1\) at the BVC to \(g_2\) at the EVC. The high point of a crest curve, or the low point of a sag curve, is where the grade is zero:
The low point of a sag curve is where the drainage inlet goes, and the high point of a crest is where the profile clears an obstacle such as a rail line. The rate of vertical curvature \(K = L/A\), the horizontal length needed per percent of grade change, is a convenient design parameter: a curve with a larger \(K\) is flatter.
Crest curves and stopping sight distance
On a crest, the road itself blocks the driver's view. The curve must be long enough that a driver with eye height \(h_1\) can see an object of height \(h_2\) on the road at least the stopping sight distance \(S\) ahead. When the sight distance is less than the curve length, which is the usual design case, the minimum length is
With a driver eye height of 1.08 m and an object height of 0.60 m, the denominator is 658, so \(L = AS^2/658\) and \(K = S^2/658\). At 80 km/h, with S = 130 m, K = 25.7, rounded to 26 in design tables. Object heights used by Canadian agencies have changed over time, from a low 0.15 m object toward taller objects representing the tail lights of a car, and some agencies specify different values; the designer uses the value in the adopted standard. This course uses 1.08 m and 0.60 m.
When the sight distance exceeds the curve length, a different formula applies, \(L = 2S - 200(\sqrt{h_1} + \sqrt{h_2})^2/A\), but it rarely governs, because short curves are also limited by a minimum length for appearance and comfort, often about 0.6 times the design speed in km/h (in metres) or three times the speed in mph (in feet).
Sag curves and headlight sight distance
On a sag curve, the driver can see far in daylight, but at night the view is limited by the headlights. The usual design criterion is headlight sight distance: the headlight beam, from a height of about 0.60 m (2 ft) and spreading upward at about 1° from the vehicle's axis, must light the road at least the stopping sight distance ahead. For S less than L, this gives
At 80 km/h, K = 130²/(120 + 3.5 × 130) = 29.4, rounded to 30. Other criteria for sag curves include riding comfort, which limits the vertical acceleration to about 0.3 m/s² and gives shorter curves, drainage, which requires a minimum grade near the low point of curbed streets, and sight distance under overhead structures. Where a sag is continuously lit, the comfort criterion may govern instead of headlight distance.
Designing the crest over the rail spur
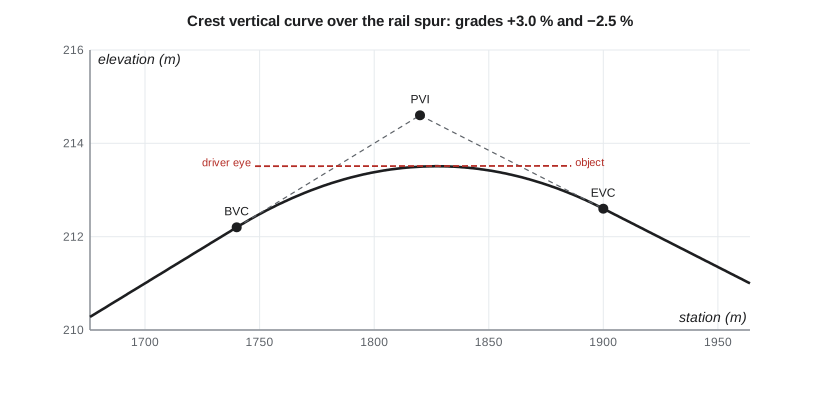
The approach grade toward the rail spur is +3.0 % and the grade beyond it is −2.5 %, so A = 5.5 %. The PVI is at station 1+820 at elevation 214.60 m, set so that the road meets the top of rail at the at-grade crossing, near the high point of the curve. The script computes K for crest and sag curves at 80 km/h, sizes the crest curve, finds the high point and elevations at 40 m intervals, checks the sight distance actually provided and sizes the sag at the creek.
# Crest and sag vertical curves on the Ridgeway Road extension
UNITS = "SI"
SI = UNITS == "SI"
if SI:
    S = 130.0                          # stopping sight distance at 80 km/h, m
    Kc = S ** 2 / 658                  # crest, eye 1.08 m, object 0.60 m (S < L)
    Ks = S ** 2 / (120 + 3.5 * S)      # sag, headlight 0.60 m, 1 degree upward spread (S < L)
    u = "m"; unit_sta = 20.0
else:
    S = 425.0                          # ft at 50 mph
    Kc = S ** 2 / 2158
    Ks = S ** 2 / (400 + 3.5 * S)
    u = "ft"; unit_sta = 50.0
print(f"K crest = {Kc:.1f}, K sag = {Ks:.1f} (length per percent of grade change, {u})")
g1, g2 = 3.0, -2.5                     # crest over the rail spur, percent
A = abs(g1 - g2)
Lc = max(Kc * A, (60 if SI else 150))  # also a minimum length for appearance
Lc = unit_sta * -(-Lc // unit_sta)     # round up to a whole station interval
print(f"crest: A = {A:.1f} %, L = {Lc:.0f} {u}")
pvi_sta = 1820.0 if SI else 5970.0; pvi_el = 214.60 if SI else 704.07
bvc = pvi_sta - Lc / 2; el_bvc = pvi_el - g1 / 100 * Lc / 2
r = (g2 - g1) / 100 / Lc
xh = -g1 / 100 / r
print(f"BVC at {bvc:.1f}, elevation {el_bvc:.2f}; high point {xh:.1f} {u} past BVC at elevation {el_bvc + g1/100*xh + r/2*xh**2:.2f}")
x = 0.0
while x <= Lc + 1e-6:
    print(f"   station {bvc + x:8.1f}   elevation {el_bvc + g1/100*x + r/2*x**2:7.2f}")
    x += unit_sta * (2 if SI else 2)
# check the sight distance actually provided by the chosen length
h1, h2 = (1.08, 0.60) if SI else (3.5, 2.0)
c = 200 * (h1 ** 0.5 + h2 ** 0.5) ** 2
Sp = (Lc * c / A) ** 0.5
print(f"sight distance provided over the crest = {Sp:.0f} {u} (needed {S:.0f})")
g3, g4 = -2.5, 1.5                     # sag at the creek crossing
Ls = unit_sta * -(-(Ks * abs(g4 - g3)) // unit_sta)
print(f"sag: A = {abs(g4-g3):.1f} %, L = {Ls:.0f} {u}")K crest = 25.7, K sag = 29.4 (length per percent of grade change, m) crest: A = 5.5 %, L = 160 m BVC at 1740.0, elevation 212.20; high point 87.3 m past BVC at elevation 213.51 station 1740.0 elevation 212.20 station 1780.0 elevation 213.12 station 1820.0 elevation 213.50 station 1860.0 elevation 213.32 station 1900.0 elevation 212.60 sight distance provided over the crest = 138 m (needed 130) sag: A = 4.0 %, L = 120 m
The crest needs a length of at least 26 × 5.5 = 141 m; rounding up to a multiple of 20 m gives 160 m. The BVC is at station 1+740 at elevation 212.20 m, and the high point is 87.3 m past the BVC at elevation 213.51 m. The 160 m curve provides about 138 m of sight distance, comfortably more than the 130 m needed. The sag at the creek, with grades of −2.5 % and +1.5 %, needs 120 m. Compared with the existing hump, which has a length of only about 50 m and gives drivers less than 80 m of sight distance, the new profile is a major safety improvement.
Worked problem
Elevation and clearance at the rail crossing
The rail crossing is at station 1+830. Find the road elevation there on the 160 m crest curve.
Show solution
- \[x = 1830 - 1740 = 90\ \text{m}\]
- \[y = 212.20 + 0.030(90) + \frac{-2.5 - 3.0}{200(160)}(90)^2 = 212.20 + 2.70 - 1.39 = 213.51\ \text{m}\]
Answer: The crossing sits almost exactly at the high point, which is good practice: the road is nearly level across the tracks, so long vehicles do not ground on the rails, and drivers have the best view along the tracks from the top of the crest.
Combining horizontal and vertical alignment
Horizontal and vertical alignment should be designed together, because drivers experience them together. A sharp horizontal curve that begins just beyond a crest is hidden from the driver until it is too late; a horizontal curve at the bottom of a long downgrade is approached at high speed. Good practice is to make vertical curves and horizontal curves roughly coincide, with the horizontal curve slightly longer and leading the vertical curve, so that the driver sees the curve's direction before reaching the crest. Avoid short dips in a long tangent, which can hide oncoming vehicles, and avoid placing intersections just beyond crests or at the bottom of long grades.
On Ridgeway, the realigned horizontal curve ends about 300 m (1,000 ft) before the crest over the rail spur, so the two do not overlap. The team considers shifting the curve so that it wraps around the crest, but that would place the rail crossing on the curve, which railway standards discourage because it twists the road across the rails and complicates sight lines along the tracks. The separated arrangement is retained, with warning signs for the crossing placed before the crest.
Railway grade crossings
At-grade road-rail crossings in Canada are governed by Transport Canada's Grade Crossings Regulations and Standards, which set requirements for sightlines, warning systems and the road profile near the crossing. The road should cross as close to a right angle as practical, with a nearly level profile across the tracks and for some distance on each side, so that vehicles stopped at the crossing can start easily and long, low vehicles do not hang up. Sightlines along the tracks must let a driver approaching the crossing, or stopped at it, see an approaching train in time. The Ridgeway crossing will have flashing lights and gates because of the industrial park's truck traffic.
Common mistakes
MistakePlacing the PVI at the BVC.
InsteadThe PVI is at the midpoint of the vertical curve's horizontal length.
MistakeUsing grades in percent without dividing by 100 in the elevation formula.
InsteadUse \(g/100\) for the linear term and \((g_2 - g_1)/(200L)\) for the curvature term.
MistakeDesigning sag curves for daylight sight distance.
InsteadUnlit sags are governed by headlight sight distance; check comfort and drainage too.
MistakeHiding a horizontal curve beyond a crest.
InsteadCoordinate the alignments so the curve begins before the crest or is visible from it.
Summary and key terms
- Profiles consist of grades joined by parabolic vertical curves; maximum and minimum grades depend on speed, terrain, trucks and drainage.
- Elevation on a curve is \(y_{BVC} + (g_1/100)x + (g_2 - g_1)x^2/(200L)\); the high or low point is at \(x = g_1 L/(g_1 - g_2)\).
- Crest curves are sized for stopping sight distance, \(L = AS^2/658\) (SI) or \(AS^2/2158\) (US) for S < L.
- Sag curves are sized for headlight sight distance, with comfort and drainage checks.
- Horizontal and vertical alignment should be coordinated; rail crossings need near-level profiles and clear sightlines.
- Vertical curve
- A parabolic curve joining two grades in the profile.
- Point of vertical intersection
- The point where the two grade lines of a vertical curve meet.
- Algebraic difference in grades
- The absolute difference between the final and initial grades, in percent.
- Rate of vertical curvature (K)
- The horizontal length of vertical curve per percent of grade change.
- Crest curve
- A vertical curve on which the grade decreases, forming a hilltop.
- Sag curve
- A vertical curve on which the grade increases, forming a valley.
- Headlight sight distance
- The length of road lit by headlights on a sag curve at night.
Practice problems
Work each problem on paper first, then reveal the answer to check.
Find the minimum crest length for A = 4 % at 100 km/h (S = 185 m).
Show answer
\(4(185^2)/658 = 208\) m.
A crest curve has g₁ = +2 %, g₂ = −3 % and L = 200 m. Where is the high point?
Show answer
\(x = 2(200)/(2 + 3) = 80\) m from the BVC.
Find the sag K for S = 160 m.
Show answer
\(160^2/(120 + 560) = 37.6\).
Why should a horizontal curve not begin just beyond a crest?
Show answer
Drivers cannot see the curve until they reach the crest, leaving little time to slow and steer.
Lesson quiz · 5 questions
Score 60% or more to complete this lesson.
Create a free account to save your progress, take quizzes and earn a certificate.