
CIV-390 · Lesson 2 of 12 · 19 min
Road users, vehicles and stopping sight distance
A road is designed for the people who use it and the vehicles they drive, ride or walk beside. Before Kestrel Bay can check the curve, the crest and the intersections on Ridgeway Road, the team needs the human and vehicle characteristics that underlie every geometric design value: how quickly a driver perceives and reacts to a hazard, how hard a vehicle can brake, how much room a turning truck needs, and how fast people walk across a street. This lesson develops those characteristics and combines them into the most important single design quantity in geometric design, the stopping sight distance.
The driver: perception and reaction
When a hazard appears, a driver must see it, recognize it as a hazard, decide what to do and begin to act. The total time for these steps is the perception-reaction time (PRT). It varies widely between drivers and situations. For an alert driver expecting a simple signal, it may be well under a second. For a driver who is not expecting the hazard, who must first notice it in a cluttered scene and then decide whether to brake or swerve, it can be two seconds or more. Age, fatigue, alcohol, distraction and complexity all lengthen it.
Design values are chosen to cover most drivers, not the average one. Studies of drivers braking for unexpected objects found that a perception-reaction time of 2.5 seconds exceeds the time of about 90 % of drivers, and this value is used for stopping sight distance in both Canadian and US practice. Situations that demand a more complex decision, such as choosing a lane at a complicated interchange, use the longer decision sight distance, with times of roughly 3 to 14 seconds depending on the manoeuvre and setting.
Drivers also have limits of vision. Visual acuity is sharpest in a cone of only a few degrees around the line of sight; objects outside it are noticed by motion and contrast rather than detail. At night, headlights illuminate only a limited distance, and older drivers need more light to see the same object. Glare from opposing headlights temporarily reduces vision. These limits explain why consistent, predictable designs are safer than surprises: a driver who expects a curve or an intersection will notice and respond to it sooner.
Older drivers and a changing population
The share of older drivers is growing in both countries, and design values are increasingly checked against their abilities. With age, reaction times tend to lengthen for complex decisions, sensitivity to glare increases, contrast sensitivity falls and turning the head to check for traffic becomes harder. These changes are gradual and vary greatly between people, but they have practical consequences: larger and brighter signs, advance street name signs, longer yellow intervals where speeds are high, protected left-turn phases at busy intersections, and intersections that meet at close to right angles all help older drivers, and they help everyone else too. Federal research in the United States produced a handbook of design practices for an ageing population, and many Canadian agencies apply similar ideas. For Ridgeway Road, which passes a seniors' residence near Carrick Street, the team notes these measures as part of the corridor toolbox.
Pedestrians and cyclists
People on foot walk at speeds that vary with age, ability and purpose. Typical walking speeds for healthy adults are around 1.2 to 1.5 m/s, but older pedestrians, children and people with mobility devices often walk at 1.0 m/s or slower. Canadian practice, including the Ontario Traffic Manual, uses walking speeds of about 1.0 to 1.2 m/s for pedestrian signal timing, with the lower values where older pedestrians or people with disabilities are common. The difference matters: crossing 20 m takes 17 seconds at 1.2 m/s but 20 seconds at 1.0 m/s.
Cyclists travel at roughly 15 to 30 km/h (10 to 20 mph) on level ground, slower uphill, and need lateral space for balance and to pass obstacles. They are far more vulnerable than vehicle occupants: the kinetic energy that a car carries at urban speeds is enough to cause serious injury or death to an unprotected person. This vulnerability is the reason modern guidance places so much weight on vehicle speed in places where people walk and cycle, a theme taken up in lessons 10 and 11.
Vehicles: design vehicles and turning paths
Roads must accommodate the vehicles that use them. Designers choose a design vehicle for each location, the largest vehicle that is expected to use it regularly, and check that it can make its turns. The TAC guide defines a set of design vehicles, from passenger cars through single-unit trucks and buses to tractor-semitrailers such as the WB-20 with a wheelbase of about 20 m. For Ridgeway Road, the design vehicle at the operations site access is a tractor-semitrailer delivering road salt; at Carrick Street, it is a city bus; on the residential side streets, it is a single-unit truck such as a garbage truck. Swept-path software, or templates in the design guide, show the area the vehicle's wheels and body occupy as it turns.
A related idea is the control vehicle: a vehicle that uses a location rarely, such as a fire truck or a wide load, that must be able to make a turn even if it encroaches on other lanes or mounts a mountable curb. Choosing a very large design vehicle everywhere makes intersections wide, which lengthens pedestrian crossings and encourages fast turns by cars. Choosing the right design and control vehicles for each corner is one of the small decisions that add up to a safe street.
Vehicle performance also matters. Passenger cars can accelerate briskly and brake hard; heavy trucks accelerate slowly, lose speed on long upgrades, and need more distance to stop, although their drivers sit higher and see farther. Climbing lanes are added on long upgrades where trucks would slow traffic. The braking ability of vehicles, combined with the friction between tires and pavement, determines how far a vehicle travels while stopping.
Braking distance
A vehicle braking from speed \(v\) with a constant deceleration \(a\) on a level road travels a distance \(v^2/(2a)\) before stopping. On a grade \(G\) (as a decimal, positive uphill), gravity adds to or subtracts from the braking force, so the braking distance becomes
Older design methods expressed braking in terms of a coefficient of friction that depended on speed. Current Canadian and US guides instead use a deceleration of 3.4 m/s² (11.2 ft/s²), based on research showing that most drivers decelerate at least this rapidly in an emergency stop, and that most vehicles can do so on wet pavement. The deceleration is a comfortable maximum for the driver, not the limit of the vehicle: a car with good tires on dry pavement can stop faster. Using one value for all speeds keeps the method simple and conservative.
Stopping sight distance
The stopping sight distance (SSD) is the distance a vehicle travels from the moment the driver sees an object in the road until it stops. It is the sum of the distance travelled during the perception-reaction time and the braking distance:
In SI units, with \(V\) in km/h, \(t\) = 2.5 s and \(a\) = 3.4 m/s², this becomes \(SSD = 0.278\,V t + V^2/(254\,(a/9.81 \pm G))\), in metres. On a level road at a design speed of 80 km/h, the reaction distance is 55.6 m and the braking distance 72.6 m, for a total of about 128 m, which the guides round to 130 m.
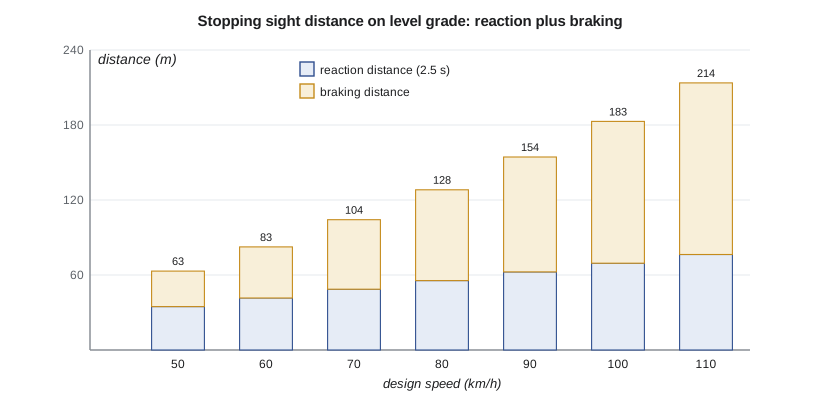
Sight distance must be available everywhere along a road, measured along the driver's path from a specified eye height to a specified object height. Where a hill crest, a building, a cut slope or a row of parked trucks blocks the view, the designer must flatten the crest, set back the obstruction or reduce the design speed. Lessons 8 and 9 apply SSD to horizontal and vertical curves.
# Stopping sight distance: perception-reaction plus braking on a grade
UNITS = "SI"
SI = UNITS == "SI"
t = 2.5                   # perception-reaction time, s
if SI:
    a, g = 3.4, 9.81      # deceleration m/s2, gravity
    speeds = [50, 60, 70, 80, 90, 100, 110]   # km/h
    conv = 1 / 3.6
    unit = "m"
else:
    a, g = 11.2, 32.2     # ft/s2
    speeds = [30, 35, 40, 45, 50, 55, 60, 65, 70]  # mph
    conv = 1.467
    unit = "ft"
def ssd(V, G=0.0):
    v = V * conv          # speed in m/s or ft/s
    return v * t + v ** 2 / (2 * g * (a / g + G))
print(f"{'speed':>6} {'reaction':>9} {'braking':>8} {'SSD':>6} {'SSD -6%':>8} {'SSD +6%':>8}")
for V in speeds:
    v = V * conv
    r = v * t; b = v ** 2 / (2 * a)
    print(f"{V:>6} {r:>9.1f} {b:>8.1f} {ssd(V):>6.0f} {ssd(V,-0.06):>8.0f} {ssd(V,0.06):>8.0f}")
# skid-mark speed estimate: a truck left 38 m / 125 ft of skid marks on wet pavement (f = 0.40)
d = 38 if SI else 125
f = 0.40
v0 = (2 * g * f * d) ** 0.5
print(f"estimated speed at start of skid = {v0/conv:.0f} {'km/h' if SI else 'mph'}") speed reaction braking SSD SSD -6% SSD +6%
50 34.7 28.4 63 69 59
60 41.7 40.8 83 91 76
70 48.6 55.6 104 116 96
80 55.6 72.6 128 143 117
90 62.5 91.9 154 174 141
100 69.4 113.5 183 207 166
110 76.4 137.3 214 242 193
estimated speed at start of skid = 62 km/hThe table shows how strongly SSD depends on speed. Going from 60 to 100 km/h, a 67 % increase in speed, more than doubles the stopping sight distance, from 83 m to 183 m. A 6 % downgrade adds about 15 m at 80 km/h. The last line estimates the speed of a truck from 38 m of skid marks on wet pavement, using a friction coefficient of 0.40 and the energy relation \(v_0 = \sqrt{2 g f d}\): about 62 km/h at the start of the skid. Collision reconstruction uses this idea, with friction measured at the site; it gives a minimum speed, because some energy was already lost before the wheels locked.
Worked problem
Sight distance at the operations site driveway
A driver on Ridgeway Road at 60 km/h approaches the operations site driveway on a 3 % downgrade. How far ahead must a stopped truck turning into the driveway be visible?
Show solution
- \[d_r = 0.278(60)(2.5) = 41.7\ \text{m}\]
- \[d_b = \frac{60^2}{254\,(3.4/9.81 - 0.03)} = \frac{3600}{254(0.317)} = 44.7\ \text{m}\]
- \[SSD = 41.7 + 44.7 = 86\ \text{m}\]
Answer: About 86 m of clear sight is needed, compared with 83 m on the level. A hedge on the inside of the gentle curve west of the driveway limits the view to about 95 m, which is adequate but should be kept trimmed.
Other sight distances
Stopping sight distance is the minimum provided everywhere. Other situations need more. Decision sight distance applies where a driver must detect an unexpected or complex condition and choose a manoeuvre, such as a lane drop, an exit or a busy intersection hidden behind a crest; it can be two or three times the SSD. Passing sight distance applies on two-lane rural roads, where drivers overtake using the opposing lane; at highway speeds it is several hundred metres (over a thousand feet), and it determines where passing zones can be marked. Intersection sight distance, covered in lesson 7, is the view a driver needs to enter or cross a road safely from a stop or yield.
Sight distance is also affected by winter. In Thunder Bay, snowbanks left by plows can block sight lines at driveways and intersections for months. The city's maintenance plan for the operations site access includes hauling snow away from the sight triangles, an operational measure that complements the geometric design.
| Quantity | Typical design value (Canada) | Used for |
|---|---|---|
| Perception-reaction time | 2.5 s | Stopping sight distance |
| Deceleration | 3.4 m/s² | Braking distance |
| Driver eye height | 1.08 m | Sight distance on crests |
| Object height (stopping) | 0.60 m (varies by agency) | Sight distance on crests |
| Walking speed for clearance | 1.0 to 1.2 m/s | Pedestrian signal timing |
| SSD at 80 km/h / 50 mph | 130 m | Rural extension design |
Common mistakes
MistakeUsing the average driver's reaction time for design.
InsteadDesign values cover most drivers; 2.5 s exceeds the reaction time of about 90 % of drivers in unexpected stops.
MistakeForgetting the grade in the braking term.
InsteadDowngrades lengthen and upgrades shorten the braking distance; use \(a/g \pm G\).
MistakeMixing units in the SSD formula.
InsteadConvert speed to m/s or ft/s before multiplying by time, or use the unit-specific constants consistently.
MistakeChoosing the largest truck as the design vehicle at every corner.
InsteadSelect design and control vehicles for each location; oversized corners lengthen crossings and speed up turning cars.
Summary and key terms
- Perception-reaction time varies widely; 2.5 s is used for stopping sight distance.
- Design vehicles and swept paths set turning geometry; control vehicles may encroach.
- Braking distance is \(v^2/(2g(a/g \pm G))\) with a design deceleration of 3.4 m/s² (11.2 ft/s²).
- Stopping sight distance is reaction distance plus braking distance and must be available everywhere.
- Decision, passing and intersection sight distances apply to more demanding situations.
- Perception-reaction time
- The time from the appearance of a hazard until the driver begins to respond.
- Stopping sight distance
- The distance needed to perceive, react to and stop for an object in the road.
- Design vehicle
- The largest vehicle expected to use a location regularly, used to set turning geometry.
- Control vehicle
- A larger vehicle that uses a location rarely and may encroach when turning.
- Decision sight distance
- The sight distance needed to detect a complex condition and choose a manoeuvre.
- Passing sight distance
- The sight distance needed to overtake safely on a two-lane road.
- Swept path
- The area covered by a vehicle's body and wheels as it turns.
Practice problems
Work each problem on paper first, then reveal the answer to check.
Find the level-grade SSD at 100 km/h with t = 2.5 s and a = 3.4 m/s².
Show answer
\(0.278(100)(2.5) + 100^2/(254 \times 0.3466) = 69.5 + 113.6 = 183\) m.
How much does a 5 % upgrade shorten the braking distance at 80 km/h?
Show answer
Level: 72.6 m; upgrade: \(80^2/(254(0.3466 + 0.05)) = 63.5\) m; about 9 m shorter.
A pedestrian crossing is 18 m long. How long does it take at 1.0 m/s and at 1.2 m/s?
Show answer
18 s and 15 s.
Why is one design deceleration used at all speeds?
Show answer
It represents a deceleration most drivers achieve and most vehicles can sustain on wet pavement, keeping the method simple and conservative.
Lesson quiz · 5 questions
Score 60% or more to complete this lesson.
Create a free account to save your progress, take quizzes and earn a certificate.