
CIV-390 · Lesson 5 of 12 · 18 min
Capacity and level of service on freeways and multilane highways
If the city changes Ridgeway Road, some of the drivers who now use it as a shortcut will move to the bypass freeway that skirts the city. Before recommending anything that diverts traffic, Kestrel Bay must know whether the bypass can take it. That question is answered with the capacity and level of service methods of the Highway Capacity Manual, the most widely used reference for the operational analysis of roads in North America. This lesson introduces the concepts of capacity and level of service and applies the basic freeway segment method to the bypass.
Capacity and level of service
The capacity of a facility is the maximum sustainable hourly flow rate at which vehicles can reasonably be expected to pass a point or a uniform section during a given period under prevailing conditions. Several words in that definition matter. 'Sustainable' excludes brief surges; 'reasonably expected' recognizes that capacity varies from day to day; 'flow rate' means the rate in the peak 15 minutes, expressed per hour; and 'prevailing conditions' means the actual lane widths, grades, vehicle mix and drivers, not ideal ones.
Level of service (LOS) describes the quality of operation as experienced by users, graded from A (best) to F (worst). Each facility type has its own service measure: density on freeway segments and multilane highways, control delay at intersections, follower density on two-lane highways, and travel speed on urban streets. LOS A to D represent progressively more constrained but stable operation; LOS E corresponds to operation near capacity, where small disturbances cause breakdown; LOS F means demand exceeds capacity, with queues and stop-and-go traffic.
Level of service is a communication tool, not a target set by the manual. Agencies choose the LOS they consider acceptable, often LOS C or D for design in urban areas, and sometimes accept E or F in dense downtowns where widening is neither possible nor desirable. A growing number of agencies also report multimodal measures, such as pedestrian and bicycle LOS, and vehicle-kilometres travelled, so that decisions do not rest on vehicle delay alone.
The Highway Capacity Manual
The Highway Capacity Manual (HCM), published by the US Transportation Research Board and now in its seventh edition, is used across Canada as well, because there is no full Canadian equivalent. Canadian practitioners adapt it in places: the Canadian Capacity Guide for Signalized Intersections offers an alternative signal method, some provinces publish their own adjustments, and winter conditions, which reduce capacity and free-flow speed, are a recognized concern. The methods use US customary units internally; Canadian analyses usually work in those units and convert the results, or use software that does so.
The HCM uses passenger car equivalents to account for heavy vehicles. A truck occupies more road space, accelerates more slowly and climbs grades more slowly than a car, so on level terrain each truck is treated as roughly two passenger cars, and on long steep grades as many more. The heavy vehicle adjustment factor converts mixed traffic to an equivalent flow of passenger cars:
where \(P_T\) is the share of heavy vehicles and \(E_T\) their passenger car equivalent. The demand flow rate in passenger cars per hour per lane is then
where \(V\) is the hourly volume in one direction, \(PHF\) the peak hour factor and \(N\) the number of lanes. Recent editions of the HCM also include a driver population factor and capacity and speed adjustment factors for weather, incidents and work zones.
Basic freeway segments
A basic freeway segment is one outside the influence of ramps and weaving. Its operation is described by a family of speed-flow curves, one for each free-flow speed (FFS). The FFS is best measured in the field, as the mean speed of passenger cars at low to moderate flows; it can also be estimated from a base value adjusted for lane width, lateral clearance and ramp density. At low flows, speed stays at the FFS. Above a breakpoint, speed falls with increasing flow, reaching its lowest stable value at capacity, where the density is 45 pc/mi/ln (about 28 pc/km/ln). Capacity rises with FFS, from 2,250 pc/h/ln at an FFS of 55 mph (90 km/h) to 2,400 pc/h/ln at 70 mph (110 km/h) and above.
In recent editions, the curve for an FFS below 70 mph can be written as
with capacity \(c = 2200 + 10(FFS - 50)\) and breakpoint \(BP = 1000 + 40(75 - FFS)\), both in pc/h/ln with FFS in mph. Density is then \(D = v_p/S\), and the LOS follows from the density thresholds in the table below.
| LOS | Density (pc/mi/ln) | Density (pc/km/ln, converted) | Description |
|---|---|---|---|
| A | ≤ 11 | ≤ 7 | Free flow; vehicles almost unimpeded |
| B | > 11 to 18 | > 7 to 11 | Reasonably free flow; slight restriction |
| C | > 18 to 26 | > 11 to 16 | Speeds near free flow; manoeuvring noticeably restricted |
| D | > 26 to 35 | > 16 to 22 | Speeds begin to fall; comfort reduced |
| E | > 35 to 45 | > 22 to 28 | Operation at capacity; little room to absorb disturbances |
| F | > 45 or demand > capacity | > 28 | Breakdown; queues |
The bypass analysis
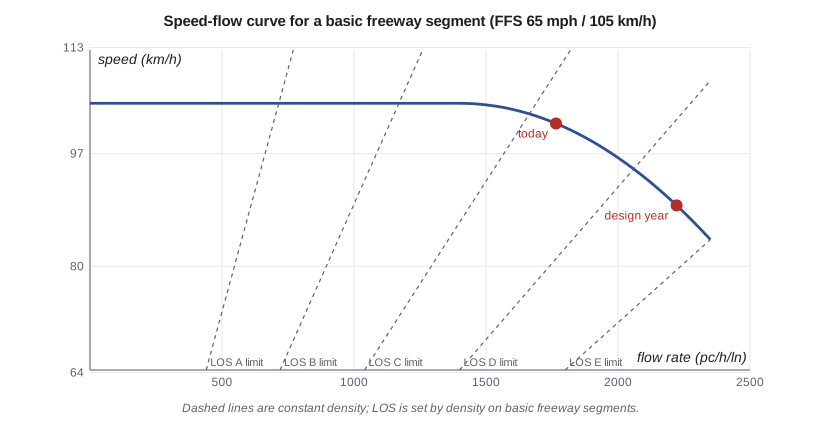
The bypass is a four-lane freeway, two lanes in each direction, on level terrain. Speed data from the province's detector station give a free-flow speed of about 105 km/h (65 mph). Today's peak-direction volume is 2,900 veh/h with 12 % heavy vehicles and a PHF of 0.92. Owen's design-year estimate is 3,650 veh/h, which includes background growth and about 300 veh/h that might divert from Ridgeway if the corridor is changed. The script computes the flow rate, speed, density and LOS for today, the design year and the design year with a third lane.
# Basic freeway segment on the bypass: flow rate, speed, density and LOS
UNITS = "SI"
SI = UNITS == "SI"
V = 3650            # peak-hour volume in one direction, veh/h (design year)
PHF = 0.92
N = 2               # lanes in each direction
PT = 0.12           # share of heavy vehicles
ET = 2.0            # passenger-car equivalent of a heavy vehicle on level terrain
FFS = 65.0          # free-flow speed, mph (105 km/h), measured on the bypass
fHV = 1 / (1 + PT * (ET - 1))
c = min(2400, 2200 + 10 * (FFS - 50))          # capacity, pc/h/ln
BP = 1000 + 40 * (75 - FFS)                    # breakpoint, pc/h/ln
def speed(vp):
    if vp <= BP: return FFS
    return FFS - (FFS - c / 45) * ((vp - BP) / (c - BP)) ** 2
LOS = [(11, 'A'), (18, 'B'), (26, 'C'), (35, 'D'), (45, 'E')]
def los(D):
    for lim, l in LOS:
        if D <= lim: return l
    return 'F'
for label, vol, lanes in (("today", 2900, 2), ("design year", V, 2), ("design year, 3 lanes", V, 3)):
    vp = vol / (PHF * lanes * fHV)
    S = speed(vp) if vp <= c else float('nan')
    D = vp / S if vp <= c else float('inf')
    if SI:
        print(f"{label:22s} vp = {vp:5.0f} pc/h/ln  v/c = {vp/c:.2f}  S = {S*1.609:5.1f} km/h  D = {D/1.609:5.1f} pc/km/ln  LOS {los(D)}")
    else:
        print(f"{label:22s} vp = {vp:5.0f} pc/h/ln  v/c = {vp/c:.2f}  S = {S:4.1f} mph  D = {D:4.1f} pc/mi/ln  LOS {los(D)}")
print(f"fHV = {fHV:.3f}, capacity = {c:.0f} pc/h/ln, breakpoint = {BP:.0f} pc/h/ln")
# service volume: the largest hourly volume that keeps LOS D on two lanes
lo, hi = 0.0, c
for _ in range(60):
    mid = (lo + hi) / 2
    if mid / speed(mid) <= 35: lo = mid
    else: hi = mid
print(f"LOS D service flow = {lo:.0f} pc/h/ln -> {lo*PHF*2*fHV:,.0f} veh/h on two lanes")today vp = 1765 pc/h/ln v/c = 0.75 S = 101.5 km/h D = 17.4 pc/km/ln LOS D design year vp = 2222 pc/h/ln v/c = 0.95 S = 89.2 km/h D = 24.9 pc/km/ln LOS E design year, 3 lanes vp = 1481 pc/h/ln v/c = 0.63 S = 104.4 km/h D = 14.2 pc/km/ln LOS C fHV = 0.893, capacity = 2350 pc/h/ln, breakpoint = 1400 pc/h/ln LOS D service flow = 2059 pc/h/ln -> 3,383 veh/h on two lanes
Today the bypass operates at LOS D, with a flow rate of about 1,770 pc/h/ln and a density of about 17 pc/km/ln (28 pc/mi/ln). In the design year, the flow rate rises to about 2,220 pc/h/ln, a volume-to-capacity ratio of 0.95, speeds drop to about 89 km/h and the density of about 25 pc/km/ln puts the segment at LOS E. A third lane in each direction would restore LOS C. The maximum hourly volume that keeps LOS D on two lanes, the service volume, is about 3,380 veh/h. The conclusion for the corridor study is important: the bypass is already busy and would be near capacity in the design year, so the Ridgeway alternatives must not rely on pushing large volumes onto it.
Worked problem
Heavy vehicle effect
A freeway direction carries 3,000 veh/h with a PHF of 0.95 on three lanes. Compare the flow rate with 5 % and with 20 % heavy vehicles, using \(E_T\) = 2.0.
Show solution
- \[f_{HV,5\%} = \frac{1}{1 + 0.05(1)} = 0.952 \;\Rightarrow\; v_p = \frac{3000}{0.95 \times 3 \times 0.952} = 1\,106\ \text{pc/h/ln}\]
- \[f_{HV,20\%} = \frac{1}{1 + 0.20(1)} = 0.833 \;\Rightarrow\; v_p = \frac{3000}{0.95 \times 3 \times 0.833} = 1\,263\ \text{pc/h/ln}\]
Answer: The higher truck share adds about 14 % to the effective flow. On a long upgrade, where trucks are worth several passenger cars each, the effect is much larger.
Other freeway elements
A freeway is more than its basic segments. Merge and diverge areas near ramps have their own methods, based on the flow in the two lanes nearest the ramp; weaving segments, where an on-ramp is followed closely by an off-ramp and drivers must change lanes in both directions, can be the capacity bottleneck of a whole facility. The HCM's freeway facility method strings segments together over time periods and tracks queues that form at bottlenecks and spread upstream. In practice, the critical point on the bypass is the on-ramp from the industrial area, where trucks merge at low speed; a merge analysis there is listed as a follow-up task.
Freeway capacity is also affected by conditions the basic method treats only through adjustment factors: snow and ice, which can reduce capacity by 10 to 20 % or more and free-flow speed by more; incidents, which can remove far more capacity than the lane they block, because drivers slow to look; and work zones. For a northern city, winter operation is a real design consideration, and a road that is at LOS E on a dry day will be in breakdown on a snowy one.
Multilane highways
Multilane highways have two or more lanes in each direction but, unlike freeways, may have at-grade intersections, driveways and, sometimes, no median. Their HCM method resembles the freeway method, with speed-flow curves, a heavy vehicle factor and density-based LOS, but the free-flow speed is reduced for lane width, lateral clearance, median type and access-point density. Capacities are somewhat lower, about 2,200 pc/h/ln at an FFS of 60 mph (about 100 km/h). Where signals are spaced closer than about 3 km (2 mi), the facility is treated as an urban street, and its performance depends on the signals, as lesson 6 explains.
Two-lane highways, such as the northern highway in lesson 3, are analysed differently, because passing requires the opposing lane. Their HCM method uses follower density, the number of vehicles in platoons per unit length, as the service measure, and accounts for passing zones and passing lanes. Adding passing lanes at intervals is one of the most cost-effective ways to improve a busy two-lane highway.
Limits of the level of service concept
Level of service has shaped decades of road building, not always well. When the only target is vehicle LOS, the remedy for every problem is more lanes, which can induce more driving, raise speeds and divide communities. Many agencies now set targets for other modes and outcomes, accept lower vehicle LOS in urban centres, and evaluate projects on safety, access and emissions as well as delay. In this course, LOS is one measure among several, and the corridor recommendations in lesson 12 weigh it against safety and the needs of people walking and cycling.
Common mistakes
MistakeUsing the hourly volume without the PHF.
InsteadCapacity analysis uses the peak 15-minute flow rate, \(V/PHF\).
MistakeForgetting to convert trucks to passenger cars.
InsteadDivide by \(f_{HV}\) so that heavy vehicles count as their equivalent number of cars.
MistakeTreating LOS E as acceptable spare capacity.
InsteadLOS E is operation at capacity; any disturbance causes breakdown.
MistakeApplying freeway methods to a road with closely spaced signals.
InsteadWith signals closer than about 3 km (2 mi), analyse it as an urban street.
Summary and key terms
- Capacity is the maximum sustainable flow rate under prevailing conditions; LOS grades operation from A to F.
- The HCM is the North American standard for operational analysis, used in both countries.
- Demand is converted to passenger cars per hour per lane with \(v_p = V/(PHF \cdot N \cdot f_{HV})\).
- On basic freeway segments, speed follows a speed-flow curve, density \(D = v_p/S\) sets the LOS, and capacity is reached at 45 pc/mi/ln.
- Multilane and two-lane highways have their own methods; LOS is one measure among several.
- Capacity
- The maximum sustainable hourly flow rate expected under prevailing conditions.
- Level of service
- A letter grade from A to F describing operating quality.
- Passenger car equivalent
- The number of passenger cars that one heavy vehicle displaces.
- Free-flow speed
- The mean speed of passenger cars at low to moderate flows.
- Service volume
- The maximum hourly volume a facility can carry at a given LOS.
- Basic freeway segment
- A freeway section outside the influence of ramps and weaving.
- Breakpoint
- The flow rate above which speed begins to fall on a speed-flow curve.
Practice problems
Work each problem on paper first, then reveal the answer to check.
A freeway direction has V = 4,200 veh/h, PHF 0.90, N = 3, 10 % trucks, \(E_T\) = 2.0. Find \(v_p\).
Show answer
\(f_{HV} = 0.909\); \(v_p = 4200/(0.90 \times 3 \times 0.909) = 1\,711\) pc/h/ln.
For FFS 70 mph, what is the capacity per lane?
Show answer
\(\min(2400, 2200 + 10(20)) = 2\,400\) pc/h/ln.
A segment has \(v_p\) = 1,900 pc/h/ln and S = 60 mph. Find the density and LOS.
Show answer
\(D = 1900/60 = 31.7\) pc/mi/ln: LOS D.
Why can snow put a facility at LOS E into breakdown?
Show answer
Snow lowers capacity and free-flow speed, so demand that was near capacity on a dry day exceeds the reduced capacity.
Lesson quiz · 5 questions
Score 60% or more to complete this lesson.
Create a free account to save your progress, take quizzes and earn a certificate.