
CIV-340 · Lesson 5 of 12 · 23 min
Compaction
Compaction is the densification of soil by mechanical energy: rolling, tamping or vibrating it so that the grains pack more tightly and air is driven out of the pores. It is the cheapest ground improvement there is, and it is used on almost every project, under footings and slabs, behind walls, in road embankments, in earth dams and in trench backfill. A well-compacted fill is strong, stiff and of low permeability; a poorly compacted one settles, softens when wet and heaves in frost. This lesson explains why water content controls compaction, how the Proctor test sets the target and how the field work is checked, using the sand pad for the salt storage shed at the operations centre.
Why compaction works
Loose soil has a high void ratio, much of it air. Rolling forces the grains closer together, which raises the dry unit weight, increases the number of contacts between grains and therefore the friction and stiffness, and reduces the voids through which water can flow. Unlike consolidation, which lesson 10 describes, compaction squeezes out air, not water, and happens in seconds as the roller passes. A compacted soil is usually unsaturated.
How much a given effort can densify a soil depends strongly on its water content. A dry soil resists compaction: friction and, in fine soils, suction between the grains keep them from sliding into a denser arrangement. Adding water lubricates the contacts and softens clods of fine soil, so the same effort produces a higher dry unit weight. Beyond a certain water content, however, the pores are so full of water that the roller cannot push the grains closer without pushing water out, which it cannot do quickly. The extra water simply takes up space that solids could have filled, and the dry unit weight falls.
The Proctor test
In 1933, R. R. Proctor, an engineer with the Los Angeles water department, described a laboratory test that reproduced the effect of field rollers on dam fill. A sample is compacted in a steel mould in layers, each receiving a fixed number of blows from a rammer dropped from a fixed height. The compacted specimen is weighed and its water content measured, so its dry unit weight is known. The test is repeated at four or five water contents, and the dry unit weight is plotted against water content. The result is a hump-shaped compaction curve whose peak defines the maximum dry unit weight and the optimum water content.
Two compactive efforts are standardized. The standard Proctor test (ASTM D698) uses a 2.5 kg rammer falling 305 mm onto three layers, about 600 kN·m/m³ of energy. The modified Proctor test (ASTM D1557), introduced for heavier airfield loads, uses a 4.5 kg rammer falling 457 mm onto five layers, about 2,700 kN·m/m³, roughly 4.5 times as much. Canadian specifications usually express density targets as a percentage of the standard Proctor maximum dry density, written % SPMDD.
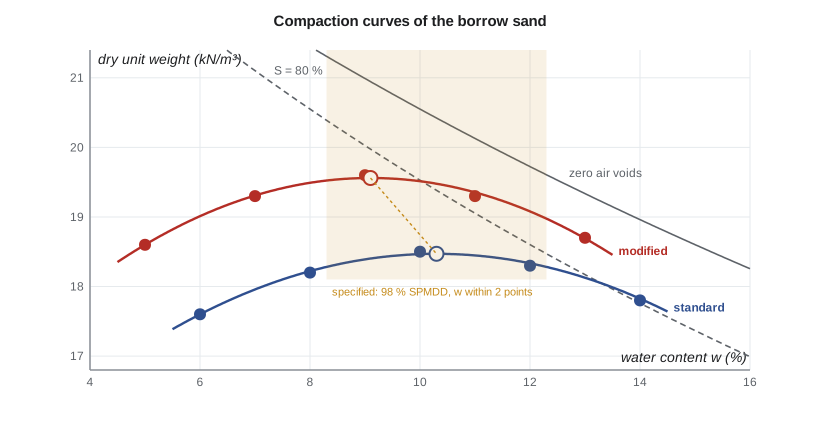
Reading the compaction curve
The compaction curve always lies below the zero-air-voids curve, which gives the dry unit weight of the soil if all air were removed, \(S = 1\):
Curves for other degrees of saturation can be drawn in the same way, replacing \(wG_s\) by \(wG_s/S\). The peaks of compaction curves usually lie at saturations between about 70 and 85 %: there is always some air left that the rammer cannot expel. A compaction test whose points plot above the zero-air-voids curve is wrong, usually because the specific gravity or the water content was mismeasured.
Greater compactive effort shifts the curve upward and to the left: the maximum dry unit weight rises and the optimum water content falls. The peaks of curves at different efforts fall along a line of optimums roughly parallel to the saturation curves. For any one soil, then, there is no single optimum water content; there is an optimum for each effort.
Soil type matters as much as effort. Well-graded sands and gravels have steep curves with high peaks; uniform sands have flat, low curves and sometimes show a second peak when dry, as capillary films hold grains apart at intermediate water contents; clays have broad, low curves with high optimum water contents. The narrower the curve, the more carefully water content must be controlled on site.
Testing the borrow sand
The salt shed pad uses the brown sand from the borrow area, the SP-SM soil of lesson 4. The laboratory ran standard and modified Proctor tests on it, five points each. Sofia's script fits a parabola through each set of points, finds the peak and checks it against the zero-air-voids curve.
# Proctor tests on the borrow sand and field density control of the salt shed pad
def fit_peak(pts):
    """Least-squares parabola through (w, gamma_d) points; returns w_opt and gamma_d,max."""
    n = len(pts)
    sx = [sum(w ** k for w, _ in pts) for k in range(5)]
    sy = [sum(g * w ** k for w, g in pts) for k in range(3)]
    # normal equations for g = a + b w + c w^2, solved by Cramer's rule
    A = [sx[0:3], sx[1:4], sx[2:5]]
    def det(M):
        return (M[0][0] * (M[1][1] * M[2][2] - M[1][2] * M[2][1]) - M[0][1] * (M[1][0] * M[2][2] - M[1][2] * M[2][0])
                + M[0][2] * (M[1][0] * M[2][1] - M[1][1] * M[2][0]))
    D = det(A); coef = []
    for j in range(3):
        M = [row[:] for row in A]
        for i in range(3):
            M[i][j] = sy[i]
        coef.append(det(M) / D)
    a, b, c = coef
    w_opt = -b / (2 * c)
    return w_opt, a + b * w_opt + c * w_opt ** 2

Gs, gw = 2.65, 9.81
standard = [(6, 17.6), (8, 18.2), (10, 18.5), (12, 18.3), (14, 17.8)]   # ASTM D698 energy
modified = [(5, 18.6), (7, 19.3), (9, 19.6), (11, 19.3), (13, 18.7)]    # ASTM D1557 energy
for name, pts in (("standard", standard), ("modified", modified)):
    wo, gmax = fit_peak(pts)
    zav = Gs * gw / (1 + wo / 100 * Gs)
    S = (wo / 100) * Gs / (Gs * gw / gmax - 1)
    print(f"{name:8s} Proctor: w_opt = {wo:.1f} %, gamma_d,max = {gmax:.2f} kN/m3, "
          f"ZAV at w_opt = {zav:.2f}, S at peak = {S:.2f}")

wo, gmax = fit_peak(standard)
spec, band = 0.98, 2.0          # 98 % of SPMDD, water content within 2 points of optimum
print(f"\nField control, lift by lift: target {spec*gmax:.2f} kN/m3 and w = {wo-band:.1f} to {wo+band:.1f} %")
tests = [("L1-1", 18.3, 9.8), ("L1-2", 18.0, 11.5), ("L2-1", 18.4, 10.2),
         ("L2-2", 17.6, 8.1), ("L3-1", 18.2, 12.0), ("L3-2", 18.5, 10.0)]
for tag, gd, w in tests:
    rc = gd / gmax
    ok = rc >= spec and abs(w - wo) <= band
print(f" {tag}: gamma_d = {gd:.1f}, w = {w:4.1f} %, compaction = {100*rc:5.1f} % SPMDD {'pass' if ok else 'REWORK'}")standard Proctor: w_opt = 10.3 %, gamma_d,max = 18.47 kN/m3, ZAV at w_opt = 20.44, S at peak = 0.67 modified Proctor: w_opt = 9.1 %, gamma_d,max = 19.56 kN/m3, ZAV at w_opt = 20.95, S at peak = 0.73 Field control, lift by lift: target 18.10 kN/m3 and w = 8.3 to 12.3 % L1-1: gamma_d = 18.3, w = 9.8 %, compaction = 99.1 % SPMDD pass L1-2: gamma_d = 18.0, w = 11.5 %, compaction = 97.5 % SPMDD REWORK L2-1: gamma_d = 18.4, w = 10.2 %, compaction = 99.6 % SPMDD pass L2-2: gamma_d = 17.6, w = 8.1 %, compaction = 95.3 % SPMDD REWORK L3-1: gamma_d = 18.2, w = 12.0 %, compaction = 98.5 % SPMDD pass L3-2: gamma_d = 18.5, w = 10.0 %, compaction = 100.2 % SPMDD pass
Worked problem
The peak of the standard Proctor curve
Standard Proctor tests gave \(\gamma_d\) = 17.6, 18.2, 18.5, 18.3 and 17.8 kN/m³ at water contents of 6, 8, 10, 12 and 14 %. With \(G_s = 2.65\), find the optimum, the maximum dry unit weight and the degree of saturation at the peak.
Show solution
- A parabola fitted to the five points peaks at
- \[w_{opt} = 10.3\ \% \qquad \gamma_{d,max} = 18.47\ \text{kN/m}^3\]
- Void ratio and saturation at the peak:
- \[e = \frac{2.65(9.81)}{18.47} - 1 = 0.408 \qquad S = \frac{0.103(2.65)}{0.408} = 0.67\]
- Zero-air-voids unit weight at the same water content:
- \[\gamma_{zav} = \frac{2.65(9.81)}{1 + 0.103(2.65)} = 20.4\ \text{kN/m}^3\]
Answer: The peak sits at two thirds saturation, which is typical of a silty sand. The modified test raises the maximum by about 6 % and lowers the optimum by about one percentage point.
Compaction specifications
A specification states the material, the lift thickness, the density target, the water content range and how compliance is checked. For the salt shed, Dr. Kowalczyk specifies the site sand placed in lifts no thicker than 300 mm before compaction, compacted to at least 98 % SPMDD, within 2 percentage points of the optimum water content. Under footings, the target would be 100 % SPMDD; under landscaped areas, 95 % is usual. These are typical of municipal and provincial practice in Ontario, though each owner's standards govern.
The water content limits matter as much as the density. Fill compacted dry of optimum has a flocculated, open structure in fine soils: it is stiff and strong when first placed but can collapse or swell when it later gets wet. Fill compacted wet of optimum is softer but more uniform and less permeable, which is why clay liners and dam cores are compacted wet of optimum. For a granular pad under a building, compacting close to optimum gives the best combination of density and workability.
Field compaction equipment
Different soils need different rollers. Smooth steel drum rollers compact granular base and asphalt. Vibratory drum rollers, which add a rotating eccentric weight, are by far the best for sands and gravels, because vibration lets grains rearrange. Sheepsfoot and padfoot rollers, with knobs on the drum, knead clays and break up clods; the knobs walk out of the soil as each lift compacts. Rubber-tired rollers give a kneading action suited to silty and clayey soils and seal the surface. In confined places, such as trench backfill and against walls, plate compactors and rammers (jumping jacks) are used, in thinner lifts.
Each machine compacts effectively only to a limited depth, so fill is placed in lifts, typically 150 to 300 mm (6 to 12 in.) before compaction, thinner for hand-operated equipment. Contractors often run a test strip at the start of a job, counting how many passes a given roller needs to reach the target density, and then control the work by method as well as by tests.
Field density tests
Field density is checked on each lift. The nuclear density gauge is the usual tool: a source of gamma radiation in a probe pushed into the fill measures density by the attenuation of radiation, and a neutron source measures the water content from the hydrogen content of the soil. A test takes a minute or two, so many can be made. The gauge needs a licensed operator and a periodic check against a direct method. The sand cone test, the traditional direct method, excavates a small hole, weighs the soil removed and measures the volume of the hole by filling it with calibrated sand. Drive cylinders are used in soft fine soils. Light weight deflectometers and roller-integrated compaction meters, which infer stiffness rather than density, are spreading on highway work.
The degree of compaction, or relative compaction, compares the field dry unit weight with the laboratory maximum:
Worked problem
Checking the third lift
On lift 3, the nuclear gauge reads \(\gamma_d = 18.2\) kN/m³ at \(w = 12.0\) % and \(\gamma_d = 18.5\) kN/m³ at \(w = 10.0\) %. Does the lift meet 98 % SPMDD within 2 points of the 10.3 % optimum?
Show solution
- \[\frac{18.2}{18.47} = 98.5\ \% \qquad \frac{18.5}{18.47} = 100.2\ \%\]
- Both water contents, 12.0 and 10.0 %, lie within 8.3 to 12.3 %.
Answer: Lift 3 passes. The script flags two earlier tests: L1-2, at 97.5 %, and L2-2, at 95.3 % and near the dry limit, so the contractor must add water and re-roll before placing the next lift.
Owen asks why the specification does not simply require the highest density possible. Dr. Kowalczyk explains that the target balances cost and performance: each extra percentage point needs more passes, and above about 100 % of the standard maximum, rollers start to break particles and shear the fill instead of densifying it. The target is set so that the fill is strong and stiff enough for its purpose, with a margin for the scatter between tests.
Compacting fine soils
The till and clay at the site are not used under the salt shed, but they will be used in landscaped berms and the clay in the liner of the stormwater pond. Fine soils are harder to compact. They must be broken into small clods, their water content adjusted by drying in the sun or by adding water and mixing, and they must be rolled with kneading equipment. Their compaction curves are flatter and their optimums higher, so a few points of water content make little difference to the density but a large difference to the strength and permeability. A clay liner compacted 2 to 4 points wet of optimum can be a hundred times less permeable than the same clay compacted dry, which is why liner specifications control the water content as tightly as the density.
Practical points
- Specify the test (standard or modified), the percentage, the water content range and the lift thickness together.
- Run a Proctor test on each borrow material; a target from another soil is meaningless.
- Do not place fill on frozen ground, and do not compact frozen fill; it settles when it thaws.
- Test every lift, in a pattern that covers the edges and the confined areas where rollers cannot reach.
- Remember that very dry fill can pass a density test and still collapse when it gets wet.
Common mistakes
MistakeQuoting a density target without naming the Proctor test.
InsteadState standard or modified; the maxima differ by 5 to 10 %.
MistakeAssuming the optimum water content is a property of the soil alone.
InsteadEach compactive effort has its own optimum; heavier effort lowers it.
MistakePlotting compaction points above the zero-air-voids curve without questioning them.
InsteadPoints cannot lie above it; recheck Gs and the water contents.
MistakeCompacting thick lifts with a light plate compactor.
InsteadMatch lift thickness to the equipment; small compactors need thin lifts.
Summary and key terms
- Compaction densifies soil by expelling air; it raises strength and stiffness and lowers permeability.
- The Proctor test defines the maximum dry unit weight and optimum water content for a given effort.
- The compaction curve lies below the zero-air-voids curve \(\gamma_{zav} = G_s\gamma_w/(1 + wG_s)\); peaks are at 70 to 85 % saturation.
- Heavier effort raises the maximum and lowers the optimum; the modified test uses about 4.5 times the standard energy.
- The borrow sand has a standard maximum of 18.47 kN/m³ at 10.3 %; the pad is specified at 98 % SPMDD within ±2 points.
- Field control uses nuclear gauges or sand cones lift by lift, with rework where tests fail.
- Compaction
- Densification of soil by mechanical energy, expelling air from the pores.
- Optimum water content
- The water content at which a given compactive effort produces the maximum dry unit weight.
- Maximum dry unit weight
- The peak of the compaction curve for a given effort.
- Zero-air-voids curve
- The dry unit weight of a soil with all voids filled with water, plotted against water content.
- Relative compaction
- The field dry unit weight as a percentage of the laboratory maximum.
- Lift
- A layer of fill placed and compacted in one operation.
- Sheepsfoot roller
- A roller with protruding feet that knead and compact fine-grained soils.
- Nuclear density gauge
- An instrument that measures the density and water content of fill using radiation.
Practice problems
Work each problem on paper first, then reveal the answer to check.
A field test gives a wet unit weight of 20.1 kN/m³ at w = 9.5 %. The SPMDD is 18.47 kN/m³. Find the degree of compaction.
Show answer
\(\gamma_d = 20.1/1.095 = 18.36\) kN/m³; 99.4 % SPMDD.
Find the zero-air-voids dry unit weight of the sand (Gs = 2.65) at w = 14 %.
Show answer
\(\gamma_{zav} = 26.0/(1 + 0.371) = 19.0\) kN/m³.
Why are clay liners compacted wet of optimum?
Show answer
Wet of optimum the clay has a dispersed, uniform structure with much lower permeability.
Which roller would you choose for the borrow sand, and why?
Show answer
A vibratory smooth drum roller; vibration lets sand grains rearrange into a dense packing.
Lesson quiz · 5 questions
Score 60% or more to complete this lesson.
Create a free account to save your progress, take quizzes and earn a certificate.