
CIV-340 · Lesson 3 of 12 · 21 min
Grain size and plasticity
Two families of index tests sort soils into groups that behave alike. Grain size tests measure how much of a soil falls into each size range, which matters most for coarse soils: gravels and sands. Plasticity tests measure how a fine soil responds to changes in water content, which matters most for silts and clays. Together they are the basis of the classification systems of lesson 4, and they predict permeability, compressibility, frost susceptibility and strength well enough to guide the early decisions on any project. This lesson runs the tests on the sand, the clay and the till from the operations centre.
Particle size ranges
Soil particles span an enormous range of sizes, from boulders larger than 300 mm to clay platelets smaller than 0.002 mm. The Unified Soil Classification System (USCS), described in ASTM D2487 and used in Canadian practice alongside the CFEM, divides them into cobbles and boulders above 75 mm, gravel from 75 mm to 4.75 mm, sand from 4.75 mm to 0.075 mm, and fines, silt and clay, below 0.075 mm. The division between silt and clay is made by plasticity, not by size, although many references call particles smaller than 0.002 mm the clay-size fraction.
Sieve analysis
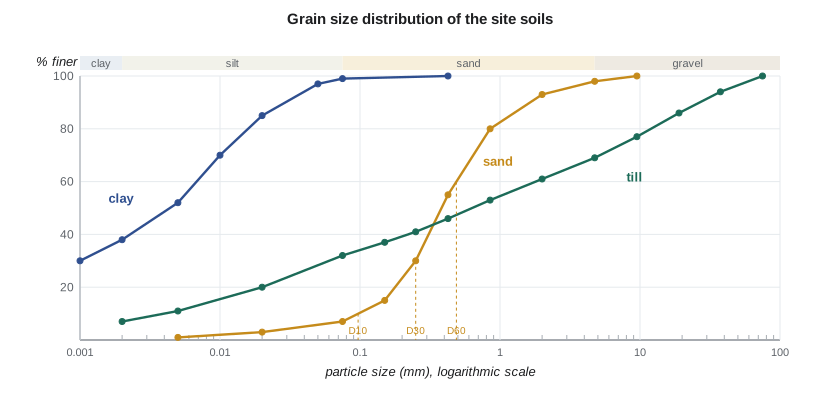
The coarse fraction is measured by sieving. A dried sample, washed first over the 0.075 mm sieve to remove fines that would otherwise cling to the sand grains, is shaken through a stack of sieves with openings decreasing from top to bottom. The mass retained on each sieve is weighed, and the percentage of the total mass passing each sieve is plotted against the sieve opening on a logarithmic scale. The result is the grain size distribution curve.
The fines are measured by sedimentation in a hydrometer test. The soil is dispersed in water with a chemical that keeps the clay particles from clumping, and the density of the suspension is read at intervals. Larger particles settle faster, following Stokes' law for a sphere settling in a fluid, so the density at a given depth and time gives the percentage of particles finer than the corresponding equivalent diameter. Clay platelets are not spheres, so hydrometer sizes are equivalent diameters, not true dimensions.
Describing the curve
The shape of the curve tells how the soil was deposited and how it will behave. A steep curve means most particles are of similar size: the soil is uniform or poorly graded, typical of beach and dune sands sorted by water and wind. A flat curve spanning many sizes means the soil is well graded, so smaller particles fill the gaps between larger ones; tills and crushed aggregates are well graded. A curve with a flat step means some sizes are missing, a gap-graded soil.
Three diameters summarize the curve: \(D_{10}\), \(D_{30}\) and \(D_{60}\), the sizes at which 10, 30 and 60 % of the soil by mass is finer. \(D_{10}\) is called the effective size, because it controls permeability and capillarity. Two coefficients describe the shape:
The coefficient of uniformity \(C_u\) measures the range of sizes, and the coefficient of curvature \(C_c\) measures the shape of the curve between \(D_{10}\) and \(D_{60}\). In the USCS, a sand is well graded if \(C_u \ge 6\) and \(1 \le C_c \le 3\), and a gravel if \(C_u \ge 4\) and \(1 \le C_c \le 3\). Otherwise it is poorly graded.
Worked problem
Gradation of the site sand
The sand from BH-3 at 1.5 m has 7 % passing 0.075 mm, 15 % passing 0.15 mm, 30 % passing 0.25 mm, 55 % passing 0.425 mm and 80 % passing 0.85 mm. Find \(D_{10}\), \(D_{30}\), \(D_{60}\), \(C_u\) and \(C_c\).
Show solution
- Interpolate on the logarithm of size. For \(D_{10}\), between 0.075 mm (7 %) and 0.15 mm (15 %):
- \[\log D_{10} = \log 0.075 + \frac{10 - 7}{15 - 7}(\log 0.15 - \log 0.075) \quad\Longrightarrow\quad D_{10} = 0.097\ \text{mm}\]
- Similarly, \(D_{30} = 0.250\) mm exactly at a sieve, and \(D_{60} = 0.488\) mm between 0.425 and 0.85 mm.
- \[C_u = \frac{0.488}{0.097} = 5.0 \qquad C_c = \frac{0.250^2}{0.097(0.488)} = 1.32\]
Answer: \(C_c\) is within 1 to 3 but \(C_u\) is below 6, so the sand is poorly graded. With 7 % fines it will carry a dual symbol in lesson 4.
Plasticity and the consistency limits
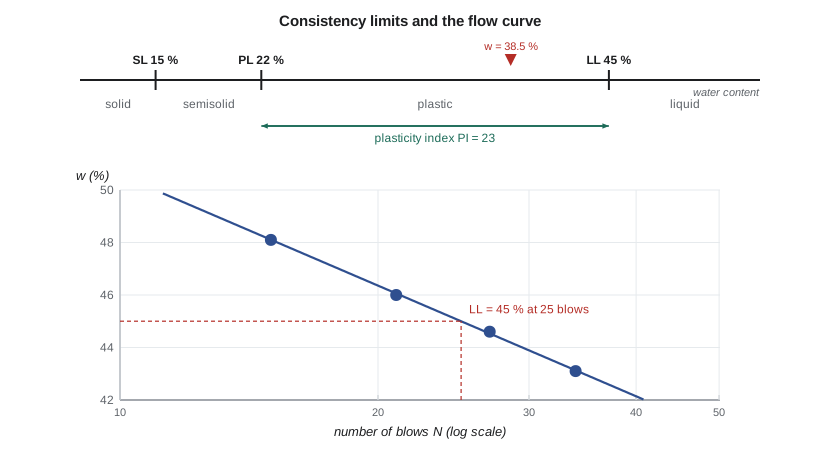
A fine soil changes its behaviour as its water content changes. Very wet, it flows like a thick liquid. As it dries it becomes plastic, able to be moulded without cracking. Drier still it becomes semisolid and crumbles when moulded, and finally it stops shrinking as it dries and is solid. Around 1911 the Swedish scientist Albert Atterberg defined the water contents at the boundaries between these states, and Arthur Casagrande later standardized the tests. They are called the Atterberg limits or consistency limits:
- The liquid limit (LL) is the water content at which the soil passes from plastic to liquid behaviour.
- The plastic limit (PL) is the water content at which the soil can no longer be rolled into a 3 mm (1/8 in.) thread without crumbling.
- The shrinkage limit (SL) is the water content below which further drying causes no further loss of volume.
Measuring the limits
In the Casagrande method, a pat of soil paste is placed in a brass cup, a groove is cut through it with a standard tool, and the cup is dropped 10 mm onto a hard rubber base by turning a crank. The number of blows needed to close the groove over 13 mm (1/2 in.) is recorded. The test is repeated at several water contents, and the liquid limit is the water content that corresponds to 25 blows on a straight line fitted to water content against the logarithm of the number of blows, called the flow curve. Many laboratories outside North America use the fall cone instead, in which a standard cone drops into the paste; the liquid limit corresponds to a fixed penetration.
The plastic limit is found by rolling a ball of soil on a glass plate into a thread. When the thread crumbles at a diameter of 3 mm (1/8 in.), its water content is the plastic limit. The test is simple but operator-dependent, and experienced technicians agree within a couple of percentage points.
From the limits come the indices that describe the soil:
The plasticity index \(PI\) is the range of water content over which the soil is plastic. The liquidity index \(LI\) places the natural water content within that range: 0 at the plastic limit, 1 at the liquid limit. A soil with \(LI\) near 1 or above is soft and sensitive and may lose much of its strength when remoulded; one near 0 is stiff. Skempton's activity \(A\) relates plasticity to the amount of clay and indicates the clay mineral: below about 0.75 is inactive, typical of kaolinite and illite; above 1.25 is active, typical of smectite, which swells.
Running the tests on the site soils
Owen sends samples of the three main soils from BH-3 to the laboratory: the sand at 1.5 m, the clay at 6 m and the till at 12 m. Sofia's script interpolates the characteristic diameters, splits each soil into gravel, sand and fines, fits the flow curve and computes the indices.
# Grain size and plasticity of the three main soils at the operations centre
from math import log10

def d_at(curve, p):
    """Diameter (mm) at p % passing, by interpolation on a log scale."""
    pts = sorted(curve)                       # (diameter, % passing), finest first
    for (d1, p1), (d2, p2) in zip(pts, pts[1:]):
        if p1 <= p <= p2:
            return 10 ** (log10(d1) + (p - p1) / (p2 - p1) * (log10(d2) - log10(d1)))
    return None

def pct_finer(curve, d):
    pts = sorted(curve)
    for (d1, p1), (d2, p2) in zip(pts, pts[1:]):
        if d1 <= d <= d2:
            return p1 + (log10(d) - log10(d1)) / (log10(d2) - log10(d1)) * (p2 - p1)
    return None

soils = {
 "sand (BH-3, 1.5 m)": [(9.5, 100), (4.75, 98), (2.0, 93), (0.85, 80), (0.425, 55), (0.25, 30),
                        (0.15, 15), (0.075, 7), (0.02, 3), (0.005, 1)],
 "till (BH-3, 12 m)":  [(75, 100), (37.5, 94), (19, 86), (9.5, 77), (4.75, 69), (2.0, 61), (0.85, 53),
                        (0.425, 46), (0.25, 41), (0.15, 37), (0.075, 32), (0.02, 20), (0.005, 11), (0.002, 7)],
 "clay (BH-3, 6 m)":   [(0.425, 100), (0.075, 99), (0.05, 97), (0.02, 85), (0.01, 70), (0.005, 52), (0.002, 38)],
}
for name, c in soils.items():
    gravel = 100 - pct_finer(c, 4.75) if c[0][0] > 4.75 else 0.0
    fines = pct_finer(c, 0.075)
    print(f"{name}: gravel {gravel:.0f} %, sand {100 - gravel - fines:.0f} %, fines {fines:.0f} %, "
          f"finer than 0.02 mm {pct_finer(c, 0.02):.0f} %")
    d10, d30, d60 = (d_at(c, p) for p in (10, 30, 60))
    if d10:
        print(f"   D10 = {d10:.3f}  D30 = {d30:.3f}  D60 = {d60:.3f} mm  "
              f"Cu = {d60/d10:.1f}  Cc = {d30**2/(d10*d60):.2f}")

# Liquid limit of the clay from four Casagrande cup points: fit w against log N
pts = [(34, 43.1), (27, 44.6), (21, 46.0), (15, 48.1)]
xs = [log10(n) for n, _ in pts]; ys = [w for _, w in pts]
xm, ym = sum(xs) / 4, sum(ys) / 4
slope = sum((x - xm) * (y - ym) for x, y in zip(xs, ys)) / sum((x - xm) ** 2 for x in xs)
LL = ym + slope * (log10(25) - xm)
PL, w_nat, clay2um = 22.0, 38.5, 38.0
PI = LL - PL
print(f"\nFlow index = {-slope:.1f} per log cycle; LL = {LL:.1f} %, PL = {PL:.0f} %, PI = {PI:.1f} %")
print(f"Liquidity index = {(w_nat - PL)/PI:.2f}; activity = PI / clay fraction = {PI/clay2um:.2f}")sand (BH-3, 1.5 m): gravel 2 %, sand 91 %, fines 7 %, finer than 0.02 mm 3 % D10 = 0.097 D30 = 0.250 D60 = 0.488 mm Cu = 5.0 Cc = 1.32 till (BH-3, 12 m): gravel 31 %, sand 37 %, fines 32 %, finer than 0.02 mm 20 % D10 = 0.004 D30 = 0.060 D60 = 1.797 mm Cu = 452.0 Cc = 0.51 clay (BH-3, 6 m): gravel 0 %, sand 1 %, fines 99 %, finer than 0.02 mm 85 % Flow index = 14.0 per log cycle; LL = 45.0 %, PL = 22 %, PI = 23.0 % Liquidity index = 0.72; activity = PI / clay fraction = 0.61
Worked problem
Indices of the varved clay
Casagrande cup tests on the clay gave water contents of 43.1, 44.6, 46.0 and 48.1 % at 34, 27, 21 and 15 blows. The plastic limit is 22 %, the natural water content 38.5 % and the clay-size fraction 38 %. Find LL, PI, LI and A.
Show solution
- The line fitted to w against log N falls 14.0 percentage points per log cycle. At 25 blows:
- \[LL = 45.0\ \%\]
- \[PI = 45.0 - 22 = 23.0 \qquad LI = \frac{38.5 - 22}{23.0} = 0.72 \qquad A = \frac{23.0}{38} = 0.61\]
Answer: The clay is of intermediate plasticity, inactive, consistent with illite and rock flour, and its natural water content sits about three quarters of the way to the liquid limit. That is typical of a firm to stiff, normally to lightly overconsolidated lake clay, and it warns that disturbance during construction will soften it.
The till is the opposite of the sand: its curve is long and flat, with \(C_u\) over 400, because the ice mixed everything from clay to cobbles. Its \(C_c\) of 0.5 is outside the range for a well-graded soil only because the curve is so flat in the middle; in practice it is described as broadly graded. Its 32 % fines will control its behaviour, and the classification in lesson 4 depends on their plasticity.
Plasticity and engineering behaviour
Plasticity is a proxy for many properties that are slow or costly to measure directly. More plastic clays are more compressible, less permeable, weaker in drained shear and more prone to shrinkage and swelling. Empirical correlations exploit this: lesson 10 estimates the compression index of the site clay from its liquid limit, and drained friction angles of clays fall as the plasticity index rises. These correlations are no substitute for tests on undisturbed samples, but they check the tests and fill in gaps.
Frost susceptibility
Ice lenses form in soils that are fine enough to draw water upward by capillarity toward a freezing front but permeable enough to supply it quickly. Clean sands and gravels are permeable but have weak suction, so they freeze in place without heaving. Clays have strong suction but transmit water too slowly. Silts and silty sands are the worst: they heave and then lose strength as the ice melts in spring. Casagrande's criterion, still used as a first screen, flags a soil as frost-susceptible when more than about 3 % of a well-graded soil, or about 10 % of a uniform soil, is finer than 0.02 mm.
The site sand has about 3 % finer than 0.02 mm. As a uniform sand it falls below Casagrande's threshold and is at most slightly frost-susceptible; it can be used for backfill around footings. The till, with about 20 % finer than 0.02 mm, is highly frost-susceptible and must not be used against foundation walls or under slabs in unheated areas. Ontario's highway specifications and municipal standards take a similar approach, limiting the fines in granular base and backfill.
| Soil | Fines (%) | D10 (mm) | Cu | LL / PI | Frost |
|---|---|---|---|---|---|
| Sand | 7 | 0.097 | 5.0 | nonplastic | slight |
| Till | 32 | 0.004 | 450 | 18 / 3 | high |
| Clay | 99 | — | — | 45 / 23 | moderate (low permeability) |
Practical points
- Always wash the sample over the finest sieve before dry sieving; dry sieving alone underestimates the fines.
- Run the Atterberg limits on the fraction passing the 0.425 mm (No. 40) sieve, as the standards require.
- Do not oven-dry organic or sensitive clays before the limits; drying changes them irreversibly. Start from the natural water content.
- Compare the natural water content with the limits on every sample. A clay near its liquid limit needs special care in excavation.
Common mistakes
MistakeInterpolating D10 linearly on the size axis.
InsteadInterpolate on the logarithm of size, as the curve is plotted.
MistakeCalling every soil with particles finer than 0.002 mm a clay.
InsteadSilt and clay are distinguished by plasticity, not only by size.
MistakeReading the liquid limit at the closest test point instead of the fitted flow curve.
InsteadFit a line to water content against log blows and read it at 25 blows.
MistakeJudging frost susceptibility by the percentage of fines passing 0.075 mm.
InsteadUse the fraction finer than 0.02 mm and the grading.
Summary and key terms
- Particle size ranges: gravel, sand, and fines below 0.075 mm, with silt and clay separated by plasticity.
- Sieving measures the coarse fraction; hydrometer tests measure the fines by sedimentation.
- \(C_u = D_{60}/D_{10}\) and \(C_c = D_{30}^2/(D_{10}D_{60})\) describe grading; well-graded sands need \(C_u \ge 6\) and \(1 \le C_c \le 3\).
- The liquid and plastic limits bound the plastic state; \(PI = LL - PL\) and \(LI = (w - PL)/PI\).
- Activity \(A = PI/\)clay fraction indicates the clay mineral and the potential to swell.
- Silts and silty soils with more than a few per cent finer than 0.02 mm are frost-susceptible.
- Grain size distribution
- The percentages by mass of a soil finer than each particle size.
- Effective size
- D10, the diameter at which 10 % of the soil is finer.
- Coefficient of uniformity
- Cu = D60/D10, a measure of the range of particle sizes.
- Coefficient of curvature
- Cc = D30²/(D10 D60), a measure of the shape of the grading curve.
- Liquid limit
- The water content at the boundary between plastic and liquid behaviour.
- Plastic limit
- The water content at which a 3 mm thread of soil begins to crumble.
- Plasticity index
- The range of water content over which a soil is plastic, LL − PL.
- Activity
- The plasticity index divided by the percentage of clay-size particles.
Practice problems
Work each problem on paper first, then reveal the answer to check.
A soil has D10 = 0.2 mm, D30 = 0.9 mm and D60 = 3.0 mm. Is it well graded?
Show answer
\(C_u = 15\), \(C_c = 0.81/0.6 = 1.35\); it is well graded.
A clay has LL = 62, PL = 28 and w = 58 %. Find PI and LI and comment.
Show answer
\(PI = 34\), \(LI = 30/34 = 0.88\); the clay is soft and near its liquid limit.
Why are hydrometer diameters called equivalent diameters?
Show answer
They are the diameters of spheres that would settle at the same speed; clay platelets are not spheres.
A clay has PI = 60 and 40 % clay-size particles. What does its activity suggest?
Show answer
\(A = 1.5\), an active clay probably containing smectite, liable to swell and shrink.
Lesson quiz · 5 questions
Score 60% or more to complete this lesson.
Create a free account to save your progress, take quizzes and earn a certificate.