
CHE-390 · Lesson 3 of 12 · 24 min
Enzyme kinetics
Glucoamylase is the second largest purchased input at Kingfisher Bioenergy after corn, and Malik wants to know whether the plant is using the right amount. Too little and dextrins remain at the end of fermentation, wasting starch; too much and money is spent on enzyme that does nothing. Answering the question starts with the kinetics of the enzyme: how fast it works at different substrate concentrations, what slows it down and how to measure its constants. Dev, who measured the esterification kinetics in CHE-345, sets up the experiments in the plant laboratory.
Enzymes as catalysts
An enzyme is a protein catalyst. Its activity comes from an active site, a pocket in the folded protein whose shape and chemical groups bind a specific substrate and lower the activation energy of a specific reaction. Enzymes speed reactions by factors of a million or more and are highly specific: glucoamylase hydrolyses alpha-1,4 and alpha-1,6 glucose bonds and almost nothing else. Like all catalysts, enzymes do not change the equilibrium of a reaction, only the rate. Unlike most chemical catalysts, they work best in a narrow band of temperature and pH, and they are slowly destroyed by heat, extreme pH, proteases and some chemicals.
Enzyme amounts are given as activity rather than mass, because commercial enzyme products are liquids containing a few percent of active protein, stabilizers and preservatives. One international unit is the amount of enzyme that converts one micromole of substrate per minute under defined conditions. Suppliers use their own units, so plants compare products by performance in their own mash. The enzyme concentration in kinetic equations is proportional to activity.
The Michaelis-Menten equation
The simplest model of enzyme action has the enzyme E bind substrate S reversibly to form a complex ES, which then breaks down to product P and free enzyme:
If the complex reaches a pseudo-steady state quickly, which Theo recognises from the PSSH treatment of catalytic mechanisms in CHE-345, the rate of product formation is
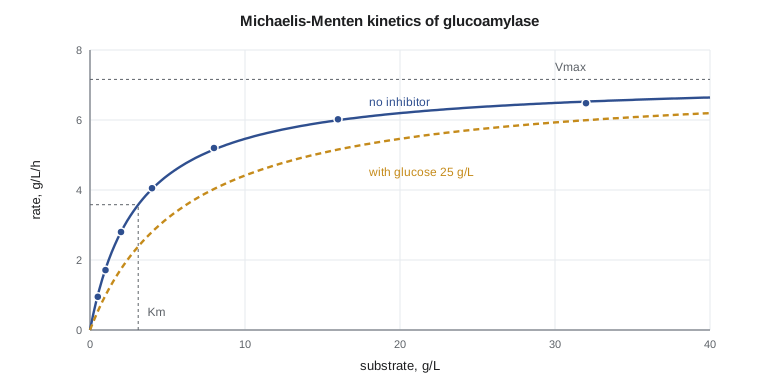
where \(V_{max} = k_{cat} E_0\) is the maximum rate at saturating substrate and \(K_m\) is the Michaelis constant, the substrate concentration at which the rate is half its maximum. At low substrate, \(S \ll K_m\), the rate is first order in substrate, \(v \approx (V_{max}/K_m) S\). At high substrate, \(S \gg K_m\), the enzyme is saturated and the rate is zero order, \(v \approx V_{max}\). The ratio \(k_{cat}/K_m\) measures how efficiently an enzyme uses a dilute substrate.
Worked problem
Rate at a given substrate
An enzyme has \(V_{max} = 7.2\) g/L/h and \(K_m = 3.1\) g/L. What is the rate at 3.1 g/L and at 31 g/L of substrate?
Show solution
- At 3.1 g/L: \(7.2 \times 3.1/6.2 = 3.6\) g/L/h, half the maximum.
- At 31 g/L: \(7.2 \times 31/34.1 = 6.5\) g/L/h, 91 % of the maximum.
Answer: 3.6 and 6.5 g/L/h.
Measuring the constants
Dev measures initial rates: he adds a known amount of glucoamylase to solutions of maltodextrin at several concentrations, takes samples every few minutes and measures the glucose released. Initial rates avoid complications from product accumulation and enzyme decay. The data must then be fitted to find \(V_{max}\) and \(K_m\). Before computers were common, the equation was linearised. The Lineweaver-Burk, or double reciprocal, form is
so a plot of \(1/v\) against \(1/S\) is a straight line with intercept \(1/V_{max}\) and slope \(K_m/V_{max}\). The Eadie-Hofstee form plots \(v\) against \(v/S\) with slope \(-K_m\). The code fits Dev's data by both linear methods and by nonlinear least squares, which fits the equation directly.
# Michaelis-Menten kinetics of glucoamylase on maltodextrin: fit Vmax and Km three ways
S = [0.5, 1, 2, 4, 8, 16, 32]                      # substrate, g/L (lab data, illustrative)
v = [0.95, 1.71, 2.80, 4.05, 5.20, 6.02, 6.48]     # initial rate, g/L/h
# 1. Lineweaver-Burk: 1/v = (Km/Vmax)(1/S) + 1/Vmax
x = [1/s for s in S]; y = [1/r for r in v]; n = len(S)
mx, my = sum(x)/n, sum(y)/n
b = sum((a-mx)*(c-my) for a, c in zip(x, y)) / sum((a-mx)**2 for a in x); a0 = my - b*mx
print(f"Lineweaver-Burk: Vmax {1/a0:.2f}  Km {b/a0:.2f}")
# 2. Eadie-Hofstee: v = Vmax - Km v/S
x2 = [r/s for r, s in zip(v, S)]; mx2, mv = sum(x2)/n, sum(v)/n
k = sum((a-mx2)*(c-mv) for a, c in zip(x2, v)) / sum((a-mx2)**2 for a in x2)
print(f"Eadie-Hofstee:   Vmax {mv - k*mx2:.2f}  Km {-k:.2f}")
# 3. Nonlinear least squares by Gauss-Newton
Vm, Km = 7.0, 3.0
for _ in range(50):
    a11 = a12 = a22 = g1 = g2 = 0.0
    for s, r in zip(S, v):
        f = Vm*s/(Km+s); j1, j2 = s/(Km+s), -Vm*s/(Km+s)**2; res = r - f
        a11 += j1*j1; a12 += j1*j2; a22 += j2*j2; g1 += j1*res; g2 += j2*res
    det = a11*a22 - a12*a12
    Vm += (a22*g1 - a12*g2)/det; Km += (a11*g2 - a12*g1)/det
print(f"Nonlinear fit:   Vmax {Vm:.2f}  Km {Km:.2f}")
# Competitive inhibition by product glucose: apparent Km = Km (1 + I/Ki)
Ki = 25.0
for I in (0, 25, 100):
print(f"glucose {I:4d} g/L: rate at S = 4 g/L is {Vm*4/(Km*(1+I/Ki)+4):.2f} g/L/h")Lineweaver-Burk: Vmax 7.43 Km 3.40 Eadie-Hofstee: Vmax 7.25 Km 3.25 Nonlinear fit: Vmax 7.16 Km 3.11 glucose 0 g/L: rate at S = 4 g/L is 4.03 g/L/h glucose 25 g/L: rate at S = 4 g/L is 2.80 g/L/h glucose 100 g/L: rate at S = 4 g/L is 1.47 g/L/h
The three methods give \(V_{max}\) from about 7.2 to 7.4 g/L/h and \(K_m\) from about 3.1 to 3.4 g/L. The differences are not mistakes: they come from how each method weights the data. The double reciprocal plot gives most weight to the lowest substrate concentrations, where rates are smallest and their relative errors largest, so a small error in one low point moves the line a lot. Nonlinear least squares weights each measured rate equally and is the preferred method today. Linear plots remain useful for seeing at a glance whether the data follow the model and what kind of inhibition is present.
Rosa adds a practical warning. Maltodextrin is not a single substrate; it is a mixture of chains of different lengths, and glucoamylase acts more slowly on short chains and on the branch points. A single pair of constants describes it only approximately, and the plant uses them for trends and comparisons rather than for exact prediction.
Inhibition
Many substances slow enzymes. In competitive inhibition, an inhibitor I binds the active site and competes with the substrate; the apparent \(K_m\) rises to \(K_m(1 + I/K_i)\) but \(V_{max}\) is unchanged, so a high enough substrate concentration overcomes the inhibitor. In noncompetitive inhibition, the inhibitor binds elsewhere and reduces \(V_{max}\) by a factor \(1/(1 + I/K_i)\) without changing \(K_m\). In uncompetitive inhibition, it binds only the complex and lowers both. Substrate inhibition, where very high substrate slows the reaction, also occurs. Each type leaves a characteristic pattern on a double reciprocal plot: competitive lines meet on the vertical axis, noncompetitive lines on the horizontal axis.
Glucose, the product of glucoamylase, inhibits the enzyme competitively. The code shows that at 100 g/L of glucose, the rate at a dextrin concentration of 4 g/L falls to little more than a third of its uninhibited value. This is one of the main reasons simultaneous saccharification and fermentation works so well: the yeast removes glucose as fast as it appears, keeping it at a few grams per litre and the enzyme working fast. A separate saccharification step, used in older plants and in some syrup processes, builds up glucose and slows itself down.
Worked problem
Competitive inhibition
With \(K_m = 3.1\) g/L, \(K_i = 25\) g/L and \(V_{max} = 7.2\) g/L/h, find the rate at \(S = 4\) g/L when glucose is 25 g/L.
Show solution
- Apparent \(K_m = 3.1 \times (1 + 25/25) = 6.2\) g/L.
- \(v = 7.2 \times 4/(6.2 + 4) = 2.8\) g/L/h.
Answer: About 2.8 g/L/h, against 4.0 without glucose.
Temperature and pH
Enzyme rates rise with temperature, roughly following the Arrhenius equation, until the protein begins to unfold. The rate measured over a fixed time therefore rises to an apparent optimum and then falls, because deactivation accelerates faster than catalysis. The optimum depends on how long the enzyme must last: an enzyme that works for 10 minutes may tolerate a higher temperature than one that must work for 60 hours. Commercial glucoamylases have optima around 55 to 65 °C over short assays, but in simultaneous saccharification they must work at 30 to 34 °C, the yeast's temperature, for two days. They are less active there but very stable.
pH affects the charges on the active site and the substrate. Each enzyme has a pH optimum: glucoamylases work best in mildly acidic conditions, roughly pH 4 to 5, which suits fermentation; the liquefaction alpha-amylases work best around pH 5 to 6. Calcium ions stabilize many alpha-amylases. Plants adjust pH and calcium between cook and fermentation to suit each enzyme. Lesson 4 treats temperature and deactivation quantitatively.
From kinetics to enzyme dose
The kinetics tell Theo how to think about dose. In the fermenter, glucose is low, so inhibition is modest, but dextrin concentrations fall steadily, so late in fermentation the enzyme works in the first-order region where rate is proportional to both enzyme and dextrin. Halving the dose roughly halves the late-stage rate and leaves more dextrin when the fermenter is dropped to the beer well. Dev runs small fermentations at several doses and measures the residual starch in the final beer. Combined with enzyme price and the value of ethanol, the results give an economic optimum that Theo will use in lesson 12.
Measuring activity in practice
Dev's assay deserves a closer look, because a kinetic constant is only as good as the measurement behind it. He keeps temperature constant in a water bath to within a tenth of a degree, because a 1 °C error changes the rate by several percent. He buffers the pH. He measures glucose by an enzymatic glucose analyser rather than by refractive index, which cannot tell glucose from dextrins. He stops each sample instantly by boiling or adding a strong base, so the enzyme does not keep working while the sample waits. And he runs each concentration in duplicate, discarding none of the points unless he can name a reason, such as a pipetting error he noticed at the time.
He also checks that the measured rates are truly initial: the glucose released in the first few minutes must rise in a straight line with time, and must be proportional to the amount of enzyme added. If doubling the enzyme does not double the rate, something else, such as mixing, substrate depletion or an impurity, is limiting. Theo recognises the same checks used for catalyst testing in CHE-345, where external mass transfer and catalyst amount had to be ruled out before rate data were trusted.
Enzyme kinetics in a reactor
Once the constants are known, the rate law can be put into a reactor balance. For a batch reactor with no inhibition, integrating the Michaelis-Menten equation gives the time to reach a given substrate concentration:
The first term is the zero-order part and the second the first-order part. When \(S_0 \gg K_m\), most of the time is spent in the zero-order region; when the target \(S\) is well below \(K_m\), the logarithmic term dominates, and the last fraction of the conversion takes a disproportionate share of the time. That is exactly what happens to the last few grams per litre of dextrin in a fermenter, and why residual starch is sensitive to enzyme dose. The same integrated form, with time replaced by residence time, applies to an ideal plug-flow reactor; for a continuous stirred tank, the rate is evaluated at the outlet concentration, as Theo learned for chemical reactors.
Theo asks one more question: how sure are the constants? Dev repeats the whole experiment on another day with a fresh enzyme lot and finds \(V_{max}\) within about 4 % and \(K_m\) within about 10 % of the first fit. Michaelis constants are usually less precise than maximum rates, because they depend on the curvature of the data at low substrate, where rates are small. For dose decisions the uncertainty is acceptable; for a model used to predict residual dextrin to a fraction of a gram per litre, it is not, and the model is calibrated against plant data as well.
Common mistakes
MistakeFitting \(K_m\) and \(V_{max}\) only by the double reciprocal plot.
InsteadUse nonlinear least squares; the linear plot overweights low-substrate points.
MistakeTreating enzyme dose by product mass alone.
InsteadCompare by activity and by performance in the plant's own mash.
MistakeAssuming the optimum temperature on a datasheet applies to a 60 h fermentation.
InsteadShort assays overstate the usable temperature because deactivation takes time.
MistakeForgetting that glucose inhibits glucoamylase.
InsteadHigh glucose slows saccharification; SSF avoids it.
Summary and key terms
- Enzymes are specific protein catalysts that work in narrow temperature and pH ranges.
- Michaelis-Menten kinetics are first order at low substrate and zero order at saturation.
- Dev's glucoamylase data give \(V_{max}\) about 7.2 g/L/h and \(K_m\) about 3.1 g/L by nonlinear fitting.
- Competitive inhibitors raise the apparent \(K_m\); glucose inhibits glucoamylase this way.
- In SSF the yeast keeps glucose low, keeping saccharification fast.
- Active site
- The part of an enzyme that binds the substrate and catalyses the reaction.
- Michaelis constant
- The substrate concentration at which the rate is half its maximum.
- Vmax
- The maximum rate at saturating substrate, proportional to enzyme concentration.
- Lineweaver-Burk plot
- A plot of 1/v against 1/S used to linearise Michaelis-Menten data.
- Competitive inhibition
- Inhibition by a molecule that competes for the active site.
- International unit
- Enzyme that converts one micromole of substrate per minute.
Practice problems
Work each problem on paper first, then reveal the answer to check.
At what substrate concentration is the rate 80 % of \(V_{max}\)?
Show answer
\(S = 4K_m\).
Which inhibition type leaves \(V_{max}\) unchanged?
Show answer
Competitive.
Why does the Lineweaver-Burk plot exaggerate error at low S?
Show answer
Small rates have large reciprocals and large relative errors.
If enzyme concentration doubles, what happens to \(V_{max}\) and \(K_m\)?
Show answer
\(V_{max}\) doubles; \(K_m\) is unchanged.
Why does SSF reduce glucose inhibition?
Show answer
The yeast consumes glucose as it forms.
Why is an enzyme's apparent optimum temperature lower for long reactions?
Show answer
Deactivation has longer to act.
Lesson quiz · 5 questions
Score 60% or more to complete this lesson.
Create a free account to save your progress, take quizzes and earn a certificate.