
CHE-250 · Lesson 5 of 12 · 24 min
Phase equilibria of pure substances
Every separation at Kingfisher Bioenergy depends on phase changes. The beer column boils ethanol and water out of the fermented mash. The evaporators concentrate thin stillage by boiling off water. The dryers drive moisture out of distillers grains. Next door, carbon dioxide is compressed and cooled until it condenses, and a little of it is expanded to make dry ice. To design or troubleshoot any of these steps, an engineer must know at what temperature and pressure each phase is stable and how much energy a phase change needs. This lesson applies the chemical potential of Lesson 3 to a single pure substance in two or more phases.
Ingrid has handed Theo a page of vapour pressure data for ethanol from an old lab notebook and asked him to extract the enthalpy of vaporization, check the normal boiling point and estimate the vapour pressure at the storage tank's hottest summer temperature. She has also asked him why the liquid carbon dioxide tanks next door sit at about −20 °C and 20 bar, and why opening a valve on one of them sometimes produces a shower of dry ice snow.
Phases and the condition for equilibrium
A phase is a region of uniform composition and physical state: ice, liquid water and water vapour are three phases of one substance. Two phases of a pure substance are in equilibrium when the chemical potential is the same in both. Because \(d\mu = V_m\,dP - S_m\,dT\) for each phase, the chemical potential of every phase falls as temperature rises, at a rate equal to its molar entropy. The gas phase, with the largest entropy, falls fastest; the solid, with the smallest, falls slowest.
At low temperature the solid has the lowest chemical potential and is the stable phase. As temperature rises, the liquid line crosses below the solid line at the melting point, and then the gas line crosses below the liquid at the boiling point. Raising the pressure raises each chemical potential by an amount proportional to the molar volume, so the gas, with by far the largest volume, is pushed up most. That is why increasing the pressure raises the boiling point: a higher temperature is needed before the gas becomes the lowest line again.
Phase diagrams
A phase diagram maps the stable phase at each temperature and pressure. Areas are regions where one phase is stable. Lines are conditions where two phases coexist in equilibrium: the sublimation curve between solid and gas, the melting curve between solid and liquid, and the vaporization curve between liquid and gas. The three curves meet at the triple point, the single temperature and pressure where solid, liquid and gas coexist. The vaporization curve ends at the critical point; beyond it there is no distinction between liquid and gas, only a single supercritical fluid.
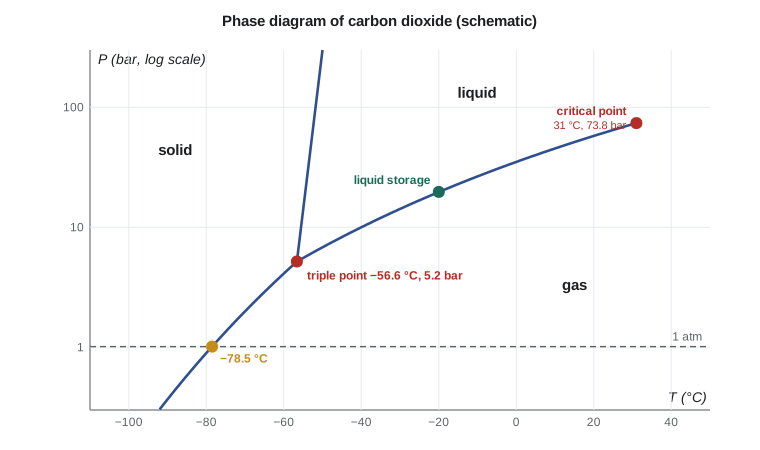
Carbon dioxide's phase diagram explains everything Ingrid asked about. Its triple point lies at about −56.6 °C and 5.2 bar, well above atmospheric pressure. Liquid carbon dioxide therefore cannot exist at 1 atm at any temperature: solid carbon dioxide at atmospheric pressure turns straight into gas, which is why it is called dry ice, and its sublimation temperature is −78.5 °C. To store carbon dioxide as a liquid, the neighbouring plant keeps it at about −20 °C, where its vapour pressure is roughly 20 bar, comfortably between the triple point and the critical point. When liquid carbon dioxide is released through a valve to atmospheric pressure, part of it flashes to gas, the flash cools the remainder below −56.6 °C, and the rest freezes into snow. The dry ice used for shipping is made by pressing that snow into blocks.
Water's phase diagram has one unusual feature: its melting line slopes slightly backward, so increasing the pressure lowers the melting point. Water is one of the very few substances whose solid is less dense than its liquid, and the Clapeyron equation below shows why that reverses the slope.
The Gibbs phase rule
How many variables can be changed independently while keeping a given set of phases in equilibrium? The Gibbs phase rule answers:
where \(F\) is the number of degrees of freedom, \(C\) the number of components and \(P\) the number of phases. For a pure substance (\(C = 1\)) in a single phase, \(F = 2\): temperature and pressure can both be varied, which is why single phases occupy areas on the diagram. With two phases, \(F = 1\): choose the temperature and the pressure is fixed, which is why two-phase equilibria are lines. At the triple point, \(F = 0\): nothing can be varied, and the triple point of water is used to define temperature scales for that reason. In Lesson 7 the phase rule explains why a binary mixture can boil over a range of temperatures at fixed pressure.
The Clapeyron equation
Along any two-phase line, the chemical potentials of both phases change together, so \(d\mu^{\alpha} = d\mu^{\beta}\). Writing each with \(d\mu = V_m\,dP - S_m\,dT\) and rearranging gives the Clapeyron equation for the slope of the line:
where \(\Delta H_m\) and \(\Delta V_m\) are the molar enthalpy and volume changes of the transition. It applies exactly to any phase boundary of a pure substance. For melting, \(\Delta H_m\) is positive and \(\Delta V_m\) is usually small and positive, so the melting line is steep and slopes forward. For water, \(\Delta V_m\) is negative because ice is less dense than liquid water, so the slope is negative.
Worked problem
How much pressure melts ice?
For ice melting at 0 °C, \(\Delta H_{fus} = 6.01\) kJ/mol, the density of ice is 0.917 g/cm³ and that of liquid water 0.9998 g/cm³. Find the slope of the melting line and the pressure increase needed to lower the melting point by 1 K.
Show solution
- Molar volumes: liquid \(18.02/0.9998 = 18.02\) cm³/mol; ice \(18.02/0.917 = 19.65\) cm³/mol.
- \(\Delta V_m = 18.02 - 19.65 = -1.63\) cm³/mol \(= -1.63 \times 10^{-6}\) m³/mol.
- \(dP/dT = 6010/(273.15 \times -1.63 \times 10^{-6}) = -1.35 \times 10^7\) Pa/K, or −135 bar/K.
Answer: About 135 bar per kelvin. The pressure under an ice skate blade is far too small to explain why ice is slippery, a popular myth; a thin liquid-like surface layer is responsible instead.
The Clausius-Clapeyron equation
For vaporization or sublimation, two approximations simplify the Clapeyron equation greatly. The molar volume of the gas is much larger than that of the liquid, so \(\Delta V_m \approx V_m^{gas}\); and the gas is close to ideal, so \(V_m^{gas} = RT/P\). Substituting gives:
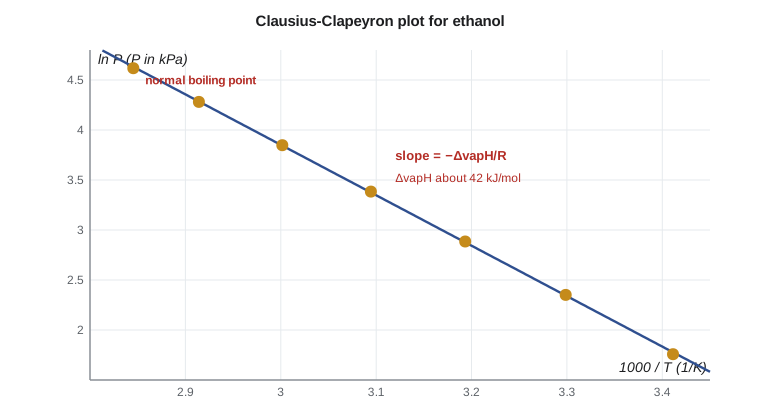
The integrated form assumes \(\Delta_{vap}H\) is constant. A plot of \(\ln P\) against \(1/T\) is then a straight line with slope \(-\Delta_{vap}H/R\), the same form as the van 't Hoff plot of Lesson 4. That is no coincidence: vaporization can be viewed as a reaction, liquid going to gas, with an equilibrium constant equal to the vapour pressure in bar.
Worked problem
Vapour pressure in a hot storage tank
Ethanol boils at 78.3 °C at 101.3 kPa, and its average enthalpy of vaporization near room temperature is about 41.9 kJ/mol. Estimate its vapour pressure at 35 °C, a hot day for the storage tank.
Show solution
- \(T_1 = 351.45\) K, \(P_1 = 101.3\) kPa; \(T_2 = 308.15\) K.
- \(\ln(P_2/P_1) = -(41{,}900/8.314)(1/308.15 - 1/351.45) = -5040 \times 4.00 \times 10^{-4} = -2.015\).
- \(P_2 = 101.3 \times e^{-2.015} = 13.5\) kPa.
Answer: About 13.5 kPa, consistent with measured values. That vapour pressure sets the emissions from the tank's breathing vents, which is why fuel ethanol tanks use internal floating roofs that sit directly on the liquid surface.
In CHE-200 you used the Antoine equation, \(\log_{10}P = A - B/(C + T)\), for vapour pressures. It is an empirical improvement on Clausius-Clapeyron: the extra constant \(C\) absorbs the slow change of \(\Delta_{vap}H\) with temperature, so Antoine fits are accurate over wider ranges. The Clausius-Clapeyron form remains the one that connects vapour pressure to a physical quantity.
Trouton's rule and the meaning of the enthalpy of vaporization
The enthalpy of vaporization is the energy needed to pull molecules apart from the liquid into the gas. It therefore measures the strength of intermolecular attraction, the well depth of Lesson 2 multiplied by the number of neighbours each molecule loses. Trouton's rule states that the entropy of vaporization at the normal boiling point, \(\Delta_{vap}H/T_b\), is roughly the same for many liquids, about 85 to 88 J/(mol K). The reason is that vaporization at 1 atm produces roughly the same increase in disorder for any liquid whose molecules are not organized in the liquid.
| Liquid | Normal boiling point (°C) | ΔvapH at T_b (kJ/mol) | ΔvapH/T_b (J/(mol K)) |
|---|---|---|---|
| Hexane | 69 | 28.9 | 85 |
| Benzene | 80 | 30.7 | 87 |
| Ethanol | 78 | 38.6 | 110 |
| Water | 100 | 40.7 | 109 |
| Methane | −162 | 8.2 | 73 |
Ethanol and water break Trouton's rule because hydrogen bonding orders the liquid. Vaporizing them destroys that order as well as separating the molecules, so the entropy of vaporization is larger. The rule is still useful for quick estimates: if you know only the normal boiling point of a nonpolar organic compound, multiplying the boiling point in kelvins by about 87 J/(mol K) gives a reasonable first estimate of its enthalpy of vaporization.
Fitting vapour pressure data
The program below fits approximate vapour pressure data for ethanol to the Clausius-Clapeyron equation by least squares, extracts the enthalpy of vaporization, predicts the normal boiling point and checks Trouton's ratio. It then applies the Clapeyron equation to the melting of ice.
# Clausius-Clapeyron fit of ethanol saturation pressures, and the Clapeyron slope for melting ice
import math
R = 8.314
# approximate ethanol saturation pressures (kPa) at temperatures in C
data = [(20, 5.8), (30, 10.5), (40, 17.9), (50, 29.5), (60, 46.9), (70, 72.3), (78.3, 101.3)]
x = [1 / (t + 273.15) for t, p in data]
y = [math.log(p) for t, p in data]
n = len(x); mx = sum(x) / n; my = sum(y) / n
slope = sum((a - mx) * (b - my) for a, b in zip(x, y)) / sum((a - mx) ** 2 for a in x)
icpt = my - slope * mx
dHvap = -slope * R
print(f"ln P = {icpt:.3f} - {-slope:.0f}/T   (P in kPa, T in K)")
print(f"enthalpy of vaporization = {dHvap / 1000:.1f} kJ/mol")
Tb = slope / (math.log(101.325) - icpt)
print(f"predicted normal boiling point = {Tb - 273.15:.1f} C")
print(f"Trouton ratio dHvap/Tb = {dHvap / Tb:.0f} J/(mol K)")
for t in (25, 35, 90):
    print(f"saturation pressure at {t} C = {math.exp(icpt + slope / (t + 273.15)):.1f} kPa")

# Clapeyron: slope of the ice-water melting line
dHfus = 6010.0                      # J/mol
dV = 18.02 / 0.9998 - 18.02 / 0.917  # cm3/mol, liquid minus ice
dPdT = dHfus / (273.15 * dV * 1e-6)  # Pa/K
print(f"\nice to water: dV = {dV:.2f} cm3/mol, dP/dT = {dPdT / 1e6:.1f} MPa/K")
print(f"pressure needed to lower the melting point by 1 K = {-dPdT / 1e5:.0f} bar")ln P = 18.987 - 5045/T (P in kPa, T in K) enthalpy of vaporization = 41.9 kJ/mol predicted normal boiling point = 78.0 C Trouton ratio dHvap/Tb = 119 J/(mol K) saturation pressure at 25 C = 7.9 kPa saturation pressure at 35 C = 13.6 kPa saturation pressure at 90 C = 162.9 kPa ice to water: dV = -1.63 cm3/mol, dP/dT = -13.5 MPa/K pressure needed to lower the melting point by 1 K = 135 bar
The fitted enthalpy, about 42 kJ/mol, is an average over 20 to 78 °C. The true value falls slowly with temperature, from about 42 kJ/mol near room temperature to 38.6 kJ/mol at the boiling point, and reaches zero at the critical point, where liquid and gas become identical. For calculations near the boiling point, use the value measured there.
Common mistakes
MistakeUsing Celsius temperatures in the Clausius-Clapeyron equation.
InsteadAlways use kelvins; the equation involves 1/T.
MistakeApplying Clausius-Clapeyron to melting.
InsteadIts approximations assume a gas phase; use the full Clapeyron equation for solid-liquid equilibria.
MistakeAssuming liquid carbon dioxide can exist at atmospheric pressure.
InsteadIts triple point is at 5.2 bar, so at 1 atm the solid sublimes directly to gas.
MistakeExpecting Trouton's rule to hold for water and alcohols.
InsteadHydrogen bonding raises their entropy of vaporization well above 87 J/(mol K).
Summary and key terms
- Two phases of a pure substance are in equilibrium when their chemical potentials are equal.
- Phase diagrams show single-phase areas, two-phase lines, a triple point and a critical point.
- The phase rule F = C − P + 2 gives 2, 1 and 0 degrees of freedom for one, two and three phases of a pure substance.
- The Clapeyron equation, dP/dT = ΔH/(TΔV), gives the slope of any phase boundary; water's melting line slopes backward.
- The Clausius-Clapeyron equation makes ln P linear in 1/T with slope −ΔvapH/R.
- Trouton's rule gives ΔvapH/T_b ≈ 87 J/(mol K) for unassociated liquids; hydrogen-bonded liquids exceed it.
- Phase
- A region of uniform composition and physical state.
- Phase diagram
- A map of the stable phase of a substance as a function of temperature and pressure.
- Triple point
- The single temperature and pressure at which solid, liquid and gas coexist.
- Critical point
- The end of the liquid-gas line, above which the two phases cannot be distinguished.
- Gibbs phase rule
- F = C − P + 2, the number of intensive variables that can be changed independently.
- Clapeyron equation
- dP/dT = ΔH/(TΔV), the slope of a two-phase boundary of a pure substance.
- Clausius-Clapeyron equation
- The approximate form for vaporization or sublimation, d ln P/dT = ΔvapH/RT².
- Trouton's rule
- The entropy of vaporization at the normal boiling point is about 87 J/(mol K) for many liquids.
Practice problems
Work each problem on paper first, then reveal the answer to check.
How many degrees of freedom does a pure substance have at its boiling point?
Show answer
One: \(F = 1 - 2 + 2 = 1\); fixing the pressure fixes the boiling temperature.
Water's vapour pressure is 3.17 kPa at 25 °C and ΔvapH is about 43.9 kJ/mol. Estimate its vapour pressure at 40 °C.
Show answer
\(\ln(P_2/3.17) = -(43{,}900/8.314)(1/313.15 - 1/298.15) = 0.848\), so \(P_2 \approx 7.4\) kPa (measured 7.38 kPa).
Use Trouton's rule to estimate ΔvapH for toluene, normal boiling point 111 °C.
Show answer
\(87 \times 384 = 33.4\) kJ/mol (measured about 33.2).
Why does a pressure cooker cook food faster?
Show answer
Higher pressure raises the boiling point of water, so the food is cooked at a higher temperature.
At what temperature does dry ice sublime at 1 atm?
Show answer
About −78.5 °C.
Why is the slope of the melting line much steeper than that of the vaporization line?
Show answer
For melting, ΔV is very small, so dP/dT = ΔH/(TΔV) is very large.
Lesson quiz · 5 questions
Score 60% or more to complete this lesson.
Create a free account to save your progress, take quizzes and earn a certificate.