
CHE-200 · Lesson 1 of 12 · 24 min
Chemical engineering and process flow diagrams
Chemical engineers turn raw materials into useful products on a scale that matters: fuels, fertilizers, plastics, medicines, clean water and food ingredients, by the tonne and by the million litres. The common tool behind all of that work is the balance. Before anyone designs a pump, sizes a reactor or prices a plant, someone must answer two questions: how much of each material goes where, and how much energy is needed to make it happen. This course teaches those two calculations, material balances and energy balances, from first principles. Every later chemical engineering course, from thermodynamics to reactor design and process control, builds on them.
Throughout the course we follow Kingfisher Bioenergy, an invented company that runs a dry-grind corn ethanol plant in Sarnia, Ontario. The plant takes in corn by truck and rail, grinds it, converts the starch to sugar with enzymes, ferments the sugar to ethanol with yeast, and separates the ethanol from water by distillation. It also sells distillers grains as livestock feed and captures carbon dioxide from the fermenters for the beverage and greenhouse markets. A natural gas boiler raises the steam that drives the distillation and drying steps. Process engineer Ingrid Solheim has taken on a co-op student, Theo Laurent, and each lesson starts with a question Theo is asked to answer for the plant.
What chemical engineers do
Chemical engineering grew out of industrial chemistry in the late nineteenth century, when people realized that the steps in very different plants, such as heating, mixing, evaporating, distilling, filtering and drying, followed the same physical rules. These shared steps came to be called unit operations. A sugar refinery, an oil refinery and a pharmaceutical plant all contain heat exchangers, pumps and separation columns, and an engineer who understands those units can work in any of them. Reactions, the chemical changes at the heart of a process, are studied in the same spirit as unit processes.
Today chemical engineers work in design, operations, research, environmental protection, safety and sales. A design engineer sizes equipment for a new plant. An operations engineer keeps an existing plant running safely and finds ways to raise its output or cut its energy use. An environmental engineer tracks every emission and effluent. All of them spend a great deal of time doing balances, often in spreadsheets or process simulators, but always on the same foundation you will learn here.
Reading a process: block flow diagrams
The first picture of any process is a block flow diagram. Each major step is a rectangle, and the streams between steps are lines with arrows. Stream labels give the flow rate and composition when they are known. A block flow diagram leaves out pumps, valves and controls; it shows only what happens to the material. It is the right level of detail for a first material balance.
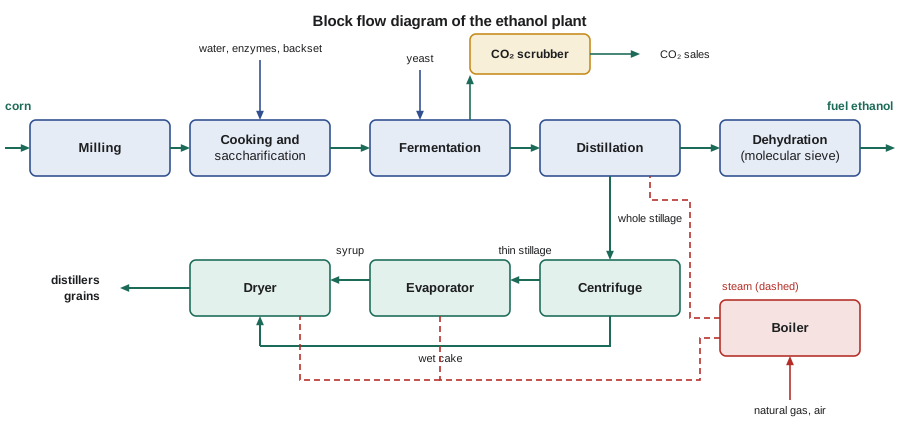
In the ethanol plant, the corn passes through a hammer mill and is mixed with water and recycled process water to form a slurry, called mash. Enzymes break the starch chains into sugar in liquefaction and saccharification. Yeast in the fermenters converts the sugar into ethanol and carbon dioxide over about two days, producing a liquid called beer that contains about 12 to 15 percent ethanol by mass. The beer column and rectifier separate a vapour of about 95 percent ethanol, and a molecular sieve removes most of the remaining water to make fuel-grade ethanol above 99 percent. The residue from the bottom of the beer column, whole stillage, is centrifuged and evaporated, and the solids are dried into distillers grains.
Process flow diagrams and piping and instrumentation diagrams
A process flow diagram, or PFD, shows the main equipment with standard symbols: pumps, heat exchangers, vessels, columns and reactors. It numbers each stream and usually includes a stream table listing flow, temperature, pressure and composition for every stream. Major control loops may appear. A PFD is what a design team uses to agree on how the process works, and it is the main output of the material and energy balance work in this course.
A piping and instrumentation diagram, or P&ID, adds every pipe, valve, instrument and safety device, with line sizes and materials. Operators and maintenance staff use P&IDs every day, and they are the basis of hazard studies. You will not draw P&IDs in this course, but you should recognize that each level of drawing rests on the balances behind it.
| Drawing | Main purpose | Typical content |
|---|---|---|
| Block flow diagram | Show the overall process and its main steps | Blocks, main streams, overall flows |
| Process flow diagram | Define the process for design | Major equipment, numbered streams, stream table, key controls |
| Piping and instrumentation diagram | Build, operate and maintain the plant | All piping, valves, instruments, relief devices, line sizes |
Batch, continuous and semibatch processes
Processes are classified by how material moves through them. In a batch process, the feed is charged to a vessel, the contents are processed, and the product is removed later; nothing crosses the boundary while processing goes on. The ethanol plant's fermenters work this way: each tank is filled, fermented for about 50 hours, emptied and cleaned. In a continuous process, feed and product streams flow without interruption. The distillation columns and the boiler run continuously for months. In a semibatch process, some material flows in or out while other material stays: a tank filled slowly with no outlet, or a reactor that vents gas while the liquid stays inside.
A process is at steady state when nothing inside it changes with time: temperatures, pressures, flows and compositions at every point stay constant. Continuous processes are designed to run at steady state, apart from startup, shutdown and upsets. Batch and semibatch processes are always transient, because the contents of the vessel change as processing goes on. Much of this course deals with continuous processes at steady state, where the arithmetic is simplest, but the same conservation law handles every case.
The general balance equation
Every material and energy balance rests on one statement. For any quantity that can be counted, such as total mass, the mass of a single chemical species, the number of atoms of an element, or energy, the amount inside a system can change only if the quantity crosses the boundary or is created or destroyed inside.
Input and output are amounts that cross the system boundary. Generation and consumption are amounts produced or used up by reactions inside the system. Accumulation is the change inside. Written for rates, every term has units such as kilograms per hour; written for a whole batch, every term is an amount such as kilograms. Two useful simplifications follow. Total mass is never created or destroyed in chemical processes, so for total mass the generation and consumption terms are zero. Atoms of an element are also conserved. Only individual molecular species can be generated or consumed by reaction.
At steady state the accumulation term is zero. For a nonreacting species at steady state, the balance becomes simply input equals output. That one line is the basis of most of the problems you will meet in the first half of the course.
Choosing a basis of calculation
A balance needs a quantity to work with. If the problem gives a flow rate, use it, or use an easy amount such as 100 kg or 100 mol of a stream whose composition is known, and scale the answer at the end. This chosen amount is the basis of calculation, and it should be stated at the top of every solution. Because material balances are linear, every flow in a correctly balanced process scales in proportion when the basis changes. A balance done on 100 kg of feed and then multiplied by 1200 gives the same answer as one done directly on 120 000 kg/h.
Worked problem
A first overall balance on the plant
The plant grinds 120 t/h of corn containing 15 percent water by mass. The dry corn is 72 percent starch. Hydrolysis adds one water molecule per glucose unit, turning starch (molar mass 162.14 g/mol per glucose unit) into glucose (180.16 g/mol). Fermentation follows \(\text{C}_6\text{H}_{12}\text{O}_6 \to 2\,\text{C}_2\text{H}_5\text{OH} + 2\,\textKingfisher Bioenergy_2\) and achieves 90 percent of the ideal yield; the unconverted sugar, together with the protein, oil and hulls, leaves in the distillers grains. Find the ethanol, carbon dioxide and dry grains produced per hour.
Show solution
- Basis: 1 h of operation. Dry corn \(= 120\,000 \times 0.85 = 102\,000\ \text{kg}\); starch \(= 0.72 \times 102\,000 = 73\,440\ \text{kg}\).
- Glucose formed \(= 73\,440 \times 180.16/162.14 = 81\,600\ \text{kg}\); water consumed \(= 81\,600 - 73\,440 = 8160\ \text{kg}\).
- Ethanol \(= 0.90 \times 81\,600 \times (2 \times 46.07/180.16) = 37\,560\ \text{kg}\); carbon dioxide \(= 0.90 \times 81\,600 \times (2 \times 44.01/180.16) = 35\,880\ \text{kg}\).
- Dry grains \(= (102\,000 - 73\,440) + 0.10 \times 81\,600 = 36\,720\ \text{kg}\).
- Check: in \(= 102\,000 + 8160 = 110\,160\ \text{kg}\); out \(= 37\,560 + 35\,880 + 36\,720 = 110\,160\ \text{kg}\).
Answer: The plant makes about 37.6 t/h of ethanol, roughly 47 600 L/h, with nearly equal masses of carbon dioxide and dry grains. The total mass balance closes, as it must, once the water that joins the starch in hydrolysis is counted as an input.
The rough rule of thumb in the industry, about one third ethanol, one third carbon dioxide and one third grains by mass of the dry corn, falls straight out of the stoichiometry. Back-of-envelope arithmetic like this is the first thing an experienced engineer does when handed a new process: a quick overall balance shows whether the numbers on a drawing make sense.
# Kingfisher Bioenergy dry-grind ethanol plant: a first overall balance
# Basis: one hour of operation at design rate. All values in kg unless noted.
corn_feed = 120_000.0           # kg/h of corn as received
moisture = 0.15                 # mass fraction water in the corn
starch_dry = 0.72               # mass fraction starch in the dry corn

dry_corn = corn_feed * (1 - moisture)
starch = dry_corn * starch_dry
# Starch hydrolysis adds water: (C6H10O5)n + n H2O -> n C6H12O6
glucose = starch * 180.16 / 162.14
# Fermentation: C6H12O6 -> 2 C2H5OH + 2 CO2, with 90 percent of the ideal yield
eff = 0.90
ethanol = glucose * (2 * 46.07 / 180.16) * eff
co2 = glucose * (2 * 44.01 / 180.16) * eff
# Everything else in the dry corn (protein, oil, hulls, unconverted sugar) leaves as distillers grains
grains = dry_corn - starch + glucose * (1 - eff)

print(f"Dry corn          {dry_corn:10.0f} kg/h")
print(f"Starch            {starch:10.0f} kg/h")
print(f"Glucose formed    {glucose:10.0f} kg/h")
print(f"Ethanol           {ethanol:10.0f} kg/h  = {ethanol / 789.0 * 1000:8.0f} L/h at 789 kg/m3")
print(f"Carbon dioxide    {co2:10.0f} kg/h")
print(f"Distillers grains {grains:10.0f} kg/h (dry basis)")
water_used = glucose - starch
print(f"Water consumed in hydrolysis {water_used:8.0f} kg/h")
# Check: mass in = mass out for the dry solids plus reacted water
mass_in = dry_corn + water_used
mass_out = ethanol + co2 + grains
print(f"Check: in {mass_in:.0f} kg/h, out {mass_out:.0f} kg/h, difference {mass_in - mass_out:.1f} kg/h")
hours = 8400
print(f"Annual ethanol at {hours} h/yr: {ethanol / 789.0 * 1000 * hours / 1e6:.0f} million L")Dry corn 102000 kg/h Starch 73440 kg/h Glucose formed 81602 kg/h Ethanol 37561 kg/h = 47605 L/h at 789 kg/m3 Carbon dioxide 35881 kg/h Distillers grains 36720 kg/h (dry basis) Water consumed in hydrolysis 8162 kg/h Check: in 110162 kg/h, out 110162 kg/h, difference 0.0 kg/h Annual ethanol at 8400 h/yr: 400 million L
Flowcharts for balance problems
For calculations, engineers redraw the process as a simple flowchart: boxes for units, arrows for streams, and every known and unknown quantity written on the arrow. Good labelling is half the solution. For each stream write the total flow and the composition, or the flow of each component, using symbols such as \(\dot{m}_3\) for an unknown mass flow and \(x_{E,3}\) for the ethanol mass fraction in stream 3. Write numbers where you know them and letters where you do not. Lesson 3 turns this into a systematic method that also tells you whether a problem can be solved before you start.
Draw the system boundary around the part of the process you are balancing. The boundary can enclose one unit, several units, a mixing point, or the whole plant. Choosing a good boundary makes the algebra easy: an overall boundary around the whole plant often gives a quick answer for the product streams, because the internal streams drop out.
Units, data and checking
Balances fail more often from careless units than from hard algebra. Keep units attached to every number, convert everything to a consistent set before combining, and state whether compositions are mass or mole fractions. Lesson 2 reviews units and process variables in detail. Finally, check every answer: does the total mass balance close, are all flows positive, are fractions between 0 and 1, and is the answer about the size you expected? A balance that does not close is a sign of an error, either in the arithmetic or in the plant's measurements.
Real plant data never balance perfectly, because flowmeters and analyzers have errors. Ingrid tells Theo that a total mass balance on the plant that closes within 2 or 3 percent is good, and one that misses by 10 percent usually means a broken meter or a stream nobody remembered, such as the water in the cleaning cycle or the moisture lost from the grain dryer. Data reconciliation methods adjust measured values so that they satisfy the balances, but that is a topic for later courses.
Common mistakes
MistakeForgetting that a reactant can join the product, as water does in starch hydrolysis.
InsteadCount every stream that crosses the boundary, including water consumed or produced by reaction.
MistakeWriting a balance for a molecular species with no generation or consumption term when it reacts.
InsteadTotal mass and atoms are conserved; individual species are not when reactions occur.
MistakeMixing mass fractions and mole fractions in one balance.
InsteadState which kind of fraction each stream uses and convert before combining.
MistakeSkipping the basis of calculation.
InsteadState the basis at the top of every solution, then scale at the end.
MistakeAssuming batch steps such as fermentation are at steady state.
InsteadBatch and semibatch steps are transient; use integral balances over the whole batch.
Summary and key terms
- Chemical processes are built from shared unit operations and reaction steps.
- Block flow diagrams show the main steps; PFDs add equipment and stream tables; P&IDs add every pipe and instrument.
- Processes are batch, continuous or semibatch; steady state means nothing changes with time.
- The general balance is accumulation = input − output + generation − consumption.
- Total mass and atoms are conserved; individual species can be generated or consumed by reaction.
- State a basis of calculation, label a flowchart, and check every answer for closure.
- Unit operation
- A physical step common to many processes, such as distillation, drying or heat exchange.
- Block flow diagram
- A simple diagram of a process showing each major step as a block.
- Process flow diagram
- A diagram showing major equipment, numbered streams and a stream table.
- Batch process
- A process in which material is charged, processed and removed, with no flow during processing.
- Continuous process
- A process with feed and product streams flowing without interruption.
- Steady state
- A condition in which no process variable changes with time.
- Basis of calculation
- The amount or flow rate chosen as the starting point for a balance.
- System boundary
- The imaginary surface enclosing the part of a process being balanced.
Practice problems
Work each problem on paper first, then reveal the answer to check.
Classify fermentation, the beer column and filling a storage tank with no outlet as batch, continuous or semibatch.
Show answer
Fermentation is batch, the beer column is continuous, and filling a tank with no outlet is semibatch.
Write the general balance for total mass in a steady continuous mixer.
Show answer
Input = output, because accumulation is zero and mass is neither generated nor consumed.
Why can a balance on ethanol in the fermenter not be written as input = output?
Show answer
Ethanol is generated by reaction, and a fermenter is a batch unit, so generation and accumulation terms are needed.
If 100 kg of feed gives 31 kg of ethanol, how much does 1500 kg/h of feed give?
Show answer
465 kg/h, because balances scale linearly with the basis.
In the program, lower the fermentation efficiency to 0.85. What happens to the grains?
Show answer
Ethanol and carbon dioxide fall and more unconverted sugar leaves in the grains, which rise to about 40 800 kg/h; the mass balance still closes.
A plant mass balance closes to within 9 percent. What should an engineer suspect?
Show answer
A faulty meter or a missing stream, such as cleaning water, vented vapour or dryer moisture.
Lesson quiz · 5 questions
Score 60% or more to complete this lesson.
Create a free account to save your progress, take quizzes and earn a certificate.