
BUS-220 · Lesson 8 of 12 · 34 min
Services marketing and customer experience
Services account for the large majority of output and employment in Canada and the United States, from banking, health care and education to restaurants, telecommunications, transportation, software subscriptions and professional services. Even firms that sell physical goods increasingly compete on the services and experiences around them. A service is an activity, benefit or satisfaction offered for sale that is essentially intangible and does not result in the ownership of anything. This lesson explains what makes services different, how firms manage service quality and capacity, how to design and map the customer experience, how to recover when things go wrong and how loyalty programs work.
Four characteristics of services
Services differ from physical goods in four ways that create special marketing challenges.
Intangibility means that services cannot be seen, tasted, felt, heard or smelled before they are bought. A person getting a haircut cannot see the result in advance; a patient cannot inspect surgery before agreeing to it. To reduce uncertainty, buyers look for signals of quality: the place, people, price, equipment and communications. The marketer's task is to make the service tangible in one or more ways, managing the evidence. A hospital's clean, calm waiting rooms, well-organized staff and clear explanations all signal competence.
Inseparability means that services are produced and consumed at the same time and cannot be separated from their providers. The provider is part of the service, and because the customer is often present as the service is produced, provider–customer interaction is a special feature of services marketing. Other customers can also be part of the experience; a noisy table in a quiet restaurant affects everyone else's evening.
Variability means that the quality of services depends on who provides them, as well as when, where and how they are provided. Even within one hotel, one front-desk employee may be cheerful and efficient while another standing a few metres away is unpleasant and slow. Service firms reduce variability through careful hiring, training, standard procedures, technology and monitoring of customer satisfaction.
Perishability means that services cannot be stored for later sale or use. An empty airline seat, an unused hotel room or an unbooked hour on a physiotherapist's schedule is lost forever. Perishability is not a problem when demand is steady, but when demand fluctuates, firms must manage supply and demand carefully, as discussed below.
| Characteristic | Meaning | Marketing responses |
|---|---|---|
| Intangibility | Cannot be seen or tested before purchase | Manage physical evidence; use testimonials, guarantees and credentials |
| Inseparability | Produced and consumed together; provider is part of the service | Train staff in interaction; manage other customers; use self-service where suitable |
| Variability | Quality depends on who, when, where and how | Standardize processes; hire and train well; monitor satisfaction |
| Perishability | Cannot be stored | Manage demand with pricing and reservations; flex capacity |
The service-profit chain and the extended mix
In a service business, the customer and the frontline employee interact to create the service. Effective interaction depends on the skills of frontline employees and on the support processes behind them. The service-profit chain, described by James Heskett and colleagues, links service-firm profits with employee and customer satisfaction in five steps: internal service quality (good employee selection, training, work environment and support) leads to satisfied and productive employees, who create greater service value, which leads to satisfied and loyal customers, who generate healthy profits and growth. The implication is that marketing in a service firm begins inside the firm, with internal marketing to employees.
Service marketers use the extended marketing mix introduced in lesson 1. People include not only the employees who deliver the service but also their appearance, attitude and skills, as well as the other customers present. Process covers the steps, flow and policies by which the service is delivered: how long a customer waits, how many forms they fill in, how easy it is to book and pay. Physical evidence includes the environment in which the service is delivered and any tangible items that support it, from the décor of a dental clinic to the design of a bank's app and the confirmation email a traveller receives.
Service firms also practise interactive marketing, recognizing that perceived service quality depends heavily on the quality of the buyer–seller interaction during the service encounter. Every contact is a moment of truth, a term popularized by Jan Carlzon of Scandinavian Airlines in the 1980s, when the customer forms an impression of the firm. Training employees in both technical skills and interaction skills, and giving them some authority to solve problems on the spot, are essential.
Service quality: SERVQUAL and the gaps model
Because services are intangible, customers judge quality by comparing what they expected with what they perceived they received. Research by A. Parasuraman, Valarie Zeithaml and Leonard Berry identified five dimensions customers use to judge service quality, often remembered by the acronym RATER.
| Dimension | Meaning | Example in a bank branch |
|---|---|---|
| Reliability | Ability to perform the promised service dependably and accurately | Transactions are recorded correctly every time |
| Assurance | Knowledge and courtesy of employees and their ability to convey trust | Advisers explain options competently |
| Tangibles | Appearance of physical facilities, equipment, staff and materials | Clean branch, working machines, clear statements |
| Empathy | Caring, individualized attention | Staff remember the customer's situation |
| Responsiveness | Willingness to help customers and provide prompt service | Short waits; quick answers to messages |
Reliability is usually the most important dimension: customers above all want the firm to do what it promised. The SERVQUAL questionnaire asks customers to rate both their expectations and their perceptions on each dimension, and the gap between them (perception minus expectation) shows where the firm falls short.
Worked problem
Finding the biggest service gap
A physiotherapy clinic surveys 150 patients on a 7-point scale. Average expectation and perception scores are: reliability 6.6 and 5.9; assurance 6.2 and 6.3; tangibles 5.1 and 5.8; empathy 6.0 and 5.7; responsiveness 6.4 and 5.2. Patients rate the importance of the dimensions as 30 %, 20 %, 10 %, 15 % and 25 % respectively. Where should the clinic focus?
Show solution
- Gaps (perception − expectation): reliability −0.7; assurance +0.1; tangibles +0.7; empathy −0.3; responsiveness −1.2.
- Weighted gaps: reliability −0.7 × 0.30 = −0.21; assurance +0.02; tangibles +0.07; empathy −0.045; responsiveness −1.2 × 0.25 = −0.30.
- Overall weighted gap = −0.21 + 0.02 + 0.07 − 0.045 − 0.30 ≈ −0.47.
- Responsiveness is the largest weighted shortfall, followed by reliability.
- The clinic exceeds expectations on tangibles, so spending more on décor would not help; it should cut waiting times and speed up replies to messages.
Answer: The clinic should prioritize responsiveness (−0.30 weighted) and reliability (−0.21). It already exceeds expectations on its facilities.
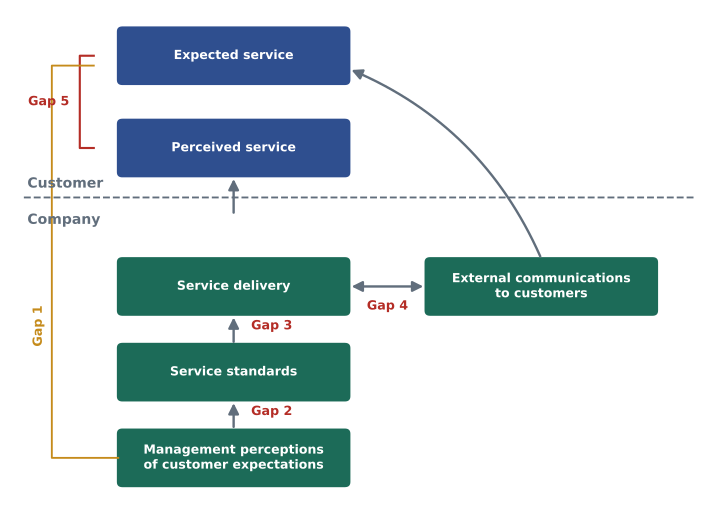
The gaps model explains where shortfalls come from. Gap 1, the listening gap, lies between what customers expect and what managers think they expect. Gap 2, the design gap, lies between managers' understanding and the service standards they set. Gap 3, the performance gap, lies between the standards and the service actually delivered. Gap 4, the communication gap, lies between the service delivered and what the firm promises in its communications. Together these produce gap 5, the customer gap between expected and perceived service. Each gap has different causes and remedies: research closes the listening gap; clear, customer-based standards close the design gap; training, technology and staffing close the performance gap; and honest, coordinated promises close the communication gap.
Designing the customer experience
Customer experience (CX) is the customer's overall perception of all their interactions with a company across every channel and stage of the relationship. A customer journey map is a visual representation of the stages a customer goes through, the touchpoints they use at each stage, what they are trying to do, how they feel and where problems arise. Journey maps are best built from research with real customers rather than from internal assumptions, and they often reveal that the customer's biggest frustrations occur at handoffs between departments that no single manager owns.
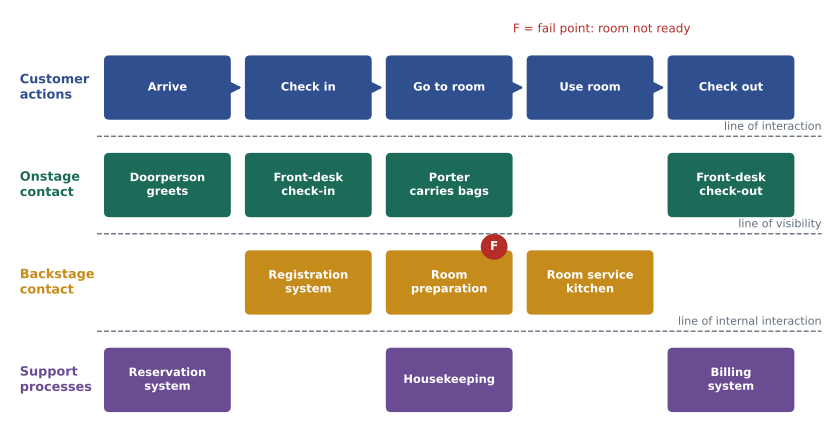
A service blueprint takes the journey map deeper by showing what happens behind the scenes. It lays out customer actions along the top, then onstage employee actions (visible to the customer), backstage employee actions (invisible) and support processes, separated by a line of interaction, a line of visibility and a line of internal interaction. Blueprints help firms find fail points, where things often go wrong, and wait points, where customers are kept waiting, and redesign the process to fix them.
Customers also judge experiences by how much effort they must expend. The Customer Effort Score (CES) asks how easy it was to get an issue resolved, and research by the Corporate Executive Board, published in 2010, suggested that reducing customer effort does more for loyalty in service interactions than trying to delight customers. In practice the best firms aim for both: reliable, low-effort service as a foundation, and moments of delight where they matter most.
The psychology of waiting is a practical example of experience design. David Maister observed that unoccupied time feels longer than occupied time, uncertain waits feel longer than known waits, unexplained waits feel longer than explained ones and unfair waits feel longer than fair ones. That is why theme parks show estimated wait times, restaurants offer menus while guests wait and banks use a single queue rather than several.
Self-service, technology and AI
Technology has changed service delivery profoundly. Self-service technologies, such as automated check-in, mobile banking, self-checkout and online account management, can lower costs and give customers control and convenience. But they work only when they are reliable and easy, and they shift effort onto the customer. Generative AI assistants now answer many routine questions, draft responses for human agents and summarize customer histories. They can improve responsiveness, but they also create risks: wrong answers delivered confidently, frustration when a customer cannot reach a person and, in some cases, legal liability. In a widely reported 2024 case, a Canadian tribunal held an airline responsible for incorrect refund information given by its website chatbot. Customers should always be told when they are dealing with an automated system and given a clear route to a human for complex or sensitive issues.
Managing demand and capacity
Because services are perishable, service firms try to match supply and demand. On the demand side, they use differential pricing (lower prices for off-peak times, such as matinee films), reservation systems, promotion of off-peak periods and complementary services that occupy customers while they wait. On the supply side, they hire part-time employees for peak periods, cross-train employees, increase customer participation, share capacity with other firms and plan for future expansion.
Airlines, hotels and car-rental firms use revenue management (also called yield management): the systematic adjustment of prices and capacity allocation to maximize revenue from a fixed, perishable capacity. Part of revenue management is overbooking, accepting more reservations than capacity because some customers will not show up. Overbooking makes sense when the expected revenue from extra sales exceeds the expected cost of compensating customers who are turned away.
Worked problem
Is it worth overbooking?
A 60-room hotel sells rooms at $180 a night. Historically 8 % of booked guests do not show and cannot be charged. If a guest with a reservation arrives and no room is available, the hotel books them into a nearby hotel and pays compensation, costing $320 on average. Should the hotel accept 62 bookings rather than 60? Assume, for simplicity, that the probability that more than 60 of 62 guests show up is about 12 %, and that when that happens one guest is usually turned away.
Show solution
- With 60 bookings, expected occupied rooms = 60 × 0.92 = 55.2.
- With 62 bookings, expected arrivals = 62 × 0.92 = 57.0, so about 1.8 more rooms are filled on average.
- Expected extra revenue ≈ 1.8 × $180 = $324 a night.
- Expected walk-away cost ≈ 0.12 × 1 × $320 = $38.40 a night.
- Net expected gain ≈ $324 − $38 ≈ $286 a night, so modest overbooking pays.
- The hotel must also consider guest goodwill and any legal rules on compensation.
Answer: Accepting two extra bookings adds about $286 of expected revenue a night. The calculation supports modest overbooking, provided displaced guests are treated well.
Service industries face specific regulation in some sectors. In Canada, the federal Air Passenger Protection Regulations set minimum compensation and standards of treatment for flight delays, cancellations, denied boarding and lost baggage, enforced by the Canadian Transportation Agency, and provinces regulate practices such as gift-card expiry dates and cancellation rights for gym memberships and other long-term service contracts. Telecommunications services are subject to the CRTC's Wireless Code and Internet Code, which limit early-cancellation fees and require clear contracts.
Service recovery
Even the best service firms make mistakes. Service recovery is what a firm does to fix a service failure and restore the customer's satisfaction. Research suggests that customers whose problems are resolved quickly and well can end up more loyal than customers who never had a problem, a finding called the service recovery paradox, although the effect is not reliable and depends on the severity of the failure and on recovery being genuinely good. A firm should never rely on failures to build loyalty, but it should treat complaints as opportunities.
Effective recovery follows a few principles. Make it easy for customers to complain, because most dissatisfied customers never complain; they simply leave. Respond quickly. Apologize sincerely and take responsibility rather than blaming the customer or another department. Fix the problem and, where appropriate, offer fair compensation proportionate to the inconvenience. Empower frontline staff to resolve common problems on the spot within set limits. Finally, learn from complaints by tracking their causes and fixing the underlying process, not just the individual case.
| Step | Good practice | Poor practice |
|---|---|---|
| Invite feedback | Easy channels; ask after each service | Hide contact details |
| Respond | Acknowledge within hours | Leave the customer waiting for days |
| Apologize | Sincere, specific, takes ownership | "Sorry you feel that way" |
| Fix and compensate | Solve the problem; proportionate gesture | Rigid adherence to policy regardless of circumstances |
| Learn | Track causes and fix the process | Treat every complaint as a one-off |
Loyalty programs
Loyalty programs reward customers for repeat purchases with points, discounts, tiers or experiences. Well-designed programs encourage customers to concentrate their spending, provide valuable first-party data (lesson 3) and allow personalized offers. Poorly designed programs simply give away margin to customers who would have bought anyway and teach customers to wait for rewards. Programs should be assessed on their incremental effect on behaviour.
The economics of a points program depend on the cost of points, the redemption rate and breakage. Breakage is the share of points that are earned but never redeemed. Accounting standards require firms to treat outstanding points as a liability, deferring part of the revenue until points are redeemed or expire, so finance and marketing teams must agree on realistic estimates.
Worked problem
The cost of a points program
A pharmacy chain gives 10 points per $1 spent; 1,000 points can be redeemed for $1 of merchandise, which costs the chain $0.65 at cost. It expects 80 % of points to be redeemed (20 % breakage). Members spend $60 million a year. What is the expected annual cost of rewards, as a percentage of member sales? If the program raises member spending by 4 % at a 30 % gross margin, does it pay for itself?
Show solution
- Points issued = $60 million × 10 = 600 million points.
- Points redeemed = 600 million × 0.80 = 480 million, worth $480,000 of merchandise at retail value.
- Cost to the chain = $480,000 × 0.65 = $312,000, or 0.52 % of member sales.
- Incremental spending = $60 million × 0.04 = $2.4 million; incremental gross margin = $2.4 million × 0.30 = $720,000.
- Before program running costs (technology, staff, marketing), net benefit ≈ $720,000 − $312,000 = $408,000.
- But if members would have spent $60 million anyway, only the 4 % increase counts; the program must cover its running costs from the $408,000.
Answer: Rewards cost about 0.5 % of member sales. A 4 % lift in spending would leave about $408,000 before running costs, so the program is worthwhile only if it truly changes behaviour and is efficiently run.
Common mistakes
MistakeTreating a service like a physical product.
InsteadDesign for intangibility, inseparability, variability and perishability.
MistakeInvesting in tangibles when reliability is the problem.
InsteadMeasure gaps by dimension; reliability usually matters most.
MistakePromising more in advertising than staff can deliver.
InsteadCoordinate communications with operations to close the communication gap.
MistakeReplacing all human contact with chatbots to cut costs.
InsteadUse automation for routine tasks, disclose it and keep a clear path to a person.
MistakeHandling complaints case by case without fixing causes.
InsteadTrack complaint causes and redesign processes.
MistakeJudging a loyalty program by how many people join.
InsteadMeasure its incremental effect on spending and retention against its full cost.
Summary and key terms
- Services are intangible, inseparable, variable and perishable.
- The service-profit chain links internal service quality and employee satisfaction to customer loyalty and profit.
- The extended mix adds people, process and physical evidence; every encounter is a moment of truth.
- SERVQUAL measures reliability, assurance, tangibles, empathy and responsiveness; gaps show where to improve.
- The gaps model identifies listening, design, performance and communication gaps.
- Journey maps and service blueprints reveal fail points, wait points and handoffs.
- Revenue management and overbooking match perishable capacity to demand.
- Good service recovery is quick, sincere, empowered and leads to process fixes.
- Loyalty programs should be judged on incremental behaviour and the true cost of rewards, including breakage.
- Service
- An intangible activity, benefit or satisfaction offered for sale that does not result in ownership.
- Perishability
- The inability of services to be stored for later sale or use.
- Service-profit chain
- The chain linking internal service quality, employee satisfaction, service value, customer loyalty and profit.
- Moment of truth
- A point of contact at which a customer forms an impression of the firm.
- SERVQUAL
- A method of measuring service quality on five dimensions by comparing expectations and perceptions.
- Customer journey map
- A visual representation of the stages, touchpoints and feelings in a customer's experience.
- Service blueprint
- A diagram of customer actions and the onstage, backstage and support processes behind them.
- Revenue management
- Adjusting prices and capacity allocation to maximize revenue from perishable capacity.
- Service recovery
- Actions to fix a service failure and restore customer satisfaction.
- Breakage
- The share of loyalty points or gift-card value that is never redeemed.
Practice problems
Work each problem on paper first, then reveal the answer to check.
Which service characteristic explains why an empty theatre seat is lost forever?
Show answer
Perishability.
How can a law firm make its intangible service more tangible?
Show answer
Professional offices, credentials, case studies, clear written proposals and client testimonials where permitted.
Name the five SERVQUAL dimensions.
Show answer
Reliability, assurance, tangibles, empathy, responsiveness.
Expectation 6.5, perception 5.5, importance 40 %. What is the weighted gap?
Show answer
−1.0 × 0.40 = −0.40.
Which gap arises when advertising promises more than the firm delivers?
Show answer
Gap 4, the communication gap.
What is a fail point in a service blueprint?
Show answer
A step where the service frequently goes wrong.
Give two demand-side tactics for managing perishability.
Show answer
Off-peak pricing and reservations.
A ferry overbooks by 5 seats, expecting 5 no-shows. What risk does it take?
Show answer
Turning away customers when fewer than 5 fail to show, with compensation and goodwill costs.
List three principles of service recovery.
Show answer
Respond quickly, apologize sincerely, fix the problem and learn from it.
Portfolio task: draw a simple journey map for a service you used recently and mark one fail point.
Show answer
Answers vary; a good answer identifies stages, touchpoints, feelings and a specific fix.
Lesson quiz · 5 questions
Score 60% or more to complete this lesson.
Create a free account to save your progress, take quizzes and earn a certificate.