
BUS-101 · Lesson 8 of 12 · 28 min
Operations and supply chains
Operations is the part of a business that actually produces the goods or delivers the services customers pay for. It turns inputs such as materials, labour, equipment, energy and information into outputs, and it usually accounts for most of a firm's costs, assets and employees. This lesson explains the transformation process, the differences between goods and services operations, capacity, productivity, quality management, inventory, lean and just-in-time methods, supply chain management and the risks that recent years have exposed.
The transformation process
Every operation, whether a sawmill, a hospital, a bank branch or a software company, can be described as a transformation process. Inputs are converted into outputs that customers value, and feedback from customers and performance measures is used to improve the process.
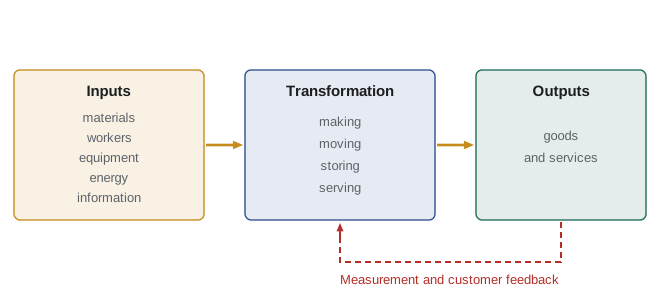
Transformations take several forms: physical (turning steel into car parts), locational (a trucking company moving goods), storage (a warehouse keeping goods until needed), exchange (a retailer transferring ownership), physiological (a clinic treating patients) and informational (an accounting firm producing tax returns).
Goods and services operations
Producing services differs from producing goods in important ways. Services are intangible, so customers cannot inspect them in advance; they are usually produced and consumed at the same time, often with the customer present; they are perishable, because an empty seat on today's flight or an unbooked hour of a consultant's time cannot be stored and sold tomorrow; and they are more variable, because they depend on the people delivering them. As a result, service operations focus heavily on scheduling capacity to match demand, staff training and the customer experience, while goods operations can use inventory to smooth out demand.
| Feature | Goods operations | Service operations |
|---|---|---|
| Output | Tangible; can be inspected | Intangible; experienced |
| Inventory | Can be stored to buffer demand | Cannot be stored; capacity is perishable |
| Customer contact | Usually low during production | Often high; customer takes part |
| Quality measurement | Against specifications | Largely through customer perception |
| Location | Near suppliers, labour or transport | Often near customers |
Process types and layout
Operations choose a process type to fit their volume and variety. Job shops make small batches of custom products, such as a custom cabinet maker or print shop, using flexible equipment and skilled workers. Batch production makes moderate quantities of similar items, such as a bakery making several types of bread. Assembly lines and repetitive processes make high volumes of standard products, such as cars or appliances. Continuous processes run around the clock for commodities such as oil refining, paper and chemicals. Mass customization combines high volume with individual choice, for example when customers configure a laptop online and it is assembled to order.
Facility layout follows process type. A process layout groups similar equipment together (all the saws in one area), which suits variety. A product layout arranges stations in the sequence of steps, which suits high volume. A fixed-position layout brings workers and materials to a product that stays put, such as a building, ship or aircraft.
Capacity and bottlenecks
Capacity is the maximum output an operation can produce in a period. A process is only as fast as its slowest step, called the bottleneck. Improving any step other than the bottleneck does not increase output; it only creates more work waiting in front of the bottleneck. Utilization is actual output divided by capacity.
Worked problem
Finding the bottleneck
A sandwich shop has three stations. The order-taker can handle 60 customers an hour, the sandwich maker can make 40 sandwiches an hour and the cashier can serve 75 customers an hour. Each customer buys one sandwich. During lunch, 50 customers arrive per hour. What is the shop's capacity, where is the bottleneck and what happens during lunch?
Show solution
- Capacity of each station: order 60, sandwich 40, cashier 75 per hour.
- The process capacity equals the slowest station: 40 customers per hour.
- The bottleneck is the sandwich station.
- At 50 arrivals per hour, the queue grows by 50 − 40 = 10 customers every hour.
- Adding a second sandwich maker for lunch (raising capacity to as much as 80, limited then by the order-taker at 60) would clear the queue; speeding up the cashier would not help at all.
Answer: Capacity is 40 customers an hour, set by the sandwich station, and the line grows by 10 people an hour at lunch. Improvements must target the bottleneck.
Productivity
Productivity measures how efficiently inputs are turned into outputs. Labour productivity is output per hour worked; multifactor productivity compares output with a combination of inputs. Productivity growth is the main source of rising living standards over time, because it allows higher wages without higher prices.
Canada's labour productivity has grown more slowly than that of the United States for many years, and the gap has widened since the pandemic. The Bank of Canada and many economists have pointed to weak business investment in machinery, equipment and technology as a key reason, and raising productivity is a major economic policy concern at the time of writing (October 2026).
Worked problem
Measuring productivity
A furniture plant produced 4,800 chairs in March using 6,000 labour hours. In April, after reorganizing its layout, it produced 5,200 chairs using 5,800 hours. By what percentage did labour productivity change?
Show solution
- March productivity = 4,800 ÷ 6,000 = 0.800 chairs per hour.
- April productivity = 5,200 ÷ 5,800 ≈ 0.897 chairs per hour.
- Change = (0.897 − 0.800) ÷ 0.800 ≈ 12.1 %.
- The plant produced 8.3 % more chairs with 3.3 % fewer hours.
- If the average hourly labour cost is $32, labour cost per chair fell from $40.00 to about $35.69.
Answer: Labour productivity rose about 12 %, cutting labour cost per chair by about $4.31.
Quality management
Quality means meeting or exceeding customer expectations, consistently. Poor quality is expensive: scrap, rework, warranty claims, returns and lost customers often cost far more than preventing defects in the first place. Total quality management (TQM) is a philosophy in which everyone in the organization is responsible for quality and works continuously to improve processes. Key ideas include focusing on the customer, preventing defects rather than inspecting them out, using data to make decisions and continuous improvement (kaizen) through many small changes.
Tools that support quality include statistical process control, which uses control charts to detect when a process drifts out of its normal range; Six Sigma, a data-driven method that aims to reduce defects to 3.4 per million opportunities; root-cause analysis such as asking 'why' five times; and the plan-do-check-act cycle. Many firms are certified to the ISO 9001 standard, which requires a documented quality management system, and some industries have their own standards.
Inventory
Inventory includes raw materials, work in process and finished goods. It protects against uncertainty in supply and demand and allows economical batch sizes, but it ties up cash and incurs carrying costs: storage, insurance, handling, obsolescence, theft and the cost of the money invested. Carrying costs often run 20 % to 30 % of inventory value per year. Managers track inventory turnover, the number of times inventory is sold and replaced in a year.
Worked problem
Inventory turnover and carrying cost
A sporting goods retailer had cost of goods sold of $3.6 million last year and average inventory of $900,000. Its carrying cost is 25 % a year. What is its inventory turnover, how many days of sales are held in inventory, and what would it save by raising turnover to 6?
Show solution
- Turnover = $3,600,000 ÷ $900,000 = 4 times a year.
- Days of inventory = 365 ÷ 4 ≈ 91 days.
- At a turnover of 6, average inventory = $3,600,000 ÷ 6 = $600,000.
- Inventory reduction = $900,000 − $600,000 = $300,000.
- Annual carrying cost saved = 25 % × $300,000 = $75,000, plus $300,000 of cash released once.
Answer: Turnover is 4 (about 91 days of stock). Raising it to 6 would free $300,000 of cash and save about $75,000 a year in carrying costs.
Lean operations and just-in-time
Lean operations, developed most famously in the Toyota Production System, aim to eliminate waste: anything that does not add value for the customer. Lean thinking identifies wastes such as overproduction, waiting, unnecessary transport, overprocessing, excess inventory, unnecessary motion and defects, often adding unused employee talent. Just-in-time (JIT) is a lean method in which materials arrive just as they are needed, keeping inventory very low. JIT lowers costs and exposes problems quickly, but it depends on reliable suppliers and transport.
Supply chain management
A supply chain is the network of organizations and activities involved in producing and delivering a product, from raw material suppliers through manufacturers, distributors and retailers to final customers, including the flows of goods, information and money. Supply chain management coordinates the whole chain to deliver value at the lowest total cost. Key decisions include whether to make or buy each component, how many suppliers to use, where to locate plants and warehouses, how much inventory to hold and where, and which transport modes to use.
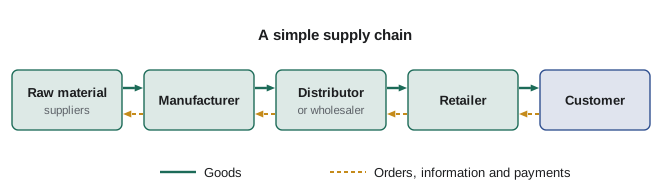
Small changes in customer demand can become large swings in orders further up the chain, a pattern called the bullwhip effect, because each stage adds safety stock and orders in batches. Sharing real sales data along the chain, ordering more often in smaller quantities and collaborating on forecasts reduce it.
Supply chain risk at the time of writing
The pandemic, extreme weather, shipping disruptions and trade disputes have shown how fragile lean global supply chains can be. Canadian firms have faced a particularly turbulent period: at the time of writing (October 2026), US tariffs under Section 232 continue to apply to steel, aluminum, autos and lumber, the United States declined in July 2026 to extend CUSMA for a new 16-year term and moved to annual reviews, and many firms are reassessing suppliers and markets. Common responses include holding more safety stock of critical items, dual sourcing, nearshoring production closer to customers, diversifying export markets and mapping suppliers beyond the first tier.
Technology also plays a growing role: sensors and tracking provide real-time visibility of shipments, forecasting software uses machine learning, robots and automated storage speed up warehouses, and digital twins let companies simulate changes before making them.
Location decisions
Where to locate a plant, warehouse, store or office is one of the longest-lasting operations decisions. Manufacturers weigh access to suppliers, transport links, the availability and cost of skilled labour, energy and land costs, taxes and incentives, and proximity to customers. Retailers and service firms focus on customer traffic, visibility, parking, competition and rent. A common tool is the weighted factor rating: list the important factors, give each a weight, score each site and pick the highest weighted total, while checking the result against judgment and risk. Trade policy has become a larger factor in recent years, as firms consider tariffs and border delays when choosing where to produce.
Operations also affects sustainability. Using less energy, material and transport usually saves money as well as emissions, which is why lean and green programs often go together.
Common mistakes
MistakeSpeeding up a step that is not the bottleneck.
InsteadFind the slowest step and improve it; output cannot exceed bottleneck capacity.
MistakeTreating inventory as free.
InsteadCount carrying costs of 20 % to 30 % a year and the cash tied up.
MistakeRelying on inspection to achieve quality.
InsteadBuild quality into the process and prevent defects at the source.
MistakeChoosing suppliers on unit price alone.
InsteadCompare total cost, including reliability, lead time, quality and risk.
MistakeAssuming just-in-time works everywhere.
InsteadJIT needs reliable suppliers and logistics; hold buffers for critical, risky items.
Summary and key terms
- Operations transforms inputs into goods and services and usually holds most of a firm's costs.
- Services are intangible, perishable, variable and often produced with the customer present.
- Process type and layout depend on volume and variety.
- Process capacity equals the capacity of the bottleneck.
- Labour productivity is output per hour worked.
- Inventory turnover is cost of goods sold divided by average inventory.
- Supply chain management coordinates goods, information and money flows and manages risk.
- Operations management
- Managing the processes that produce goods and services.
- Transformation process
- The conversion of inputs into outputs.
- Bottleneck
- The slowest step in a process, which limits total output.
- Utilization
- Actual output divided by capacity.
- Productivity
- Output divided by input, such as output per labour hour.
- Total quality management
- An organization-wide commitment to continuous quality improvement.
- Inventory turnover
- Cost of goods sold divided by average inventory.
- Just-in-time
- Receiving materials only as they are needed to minimize inventory.
- Supply chain
- The network that produces and delivers a product to the final customer.
- Bullwhip effect
- Growing swings in orders as demand signals move up the supply chain.
Practice problems
Work each problem on paper first, then reveal the answer to check.
Give two ways services differ from goods.
Show answer
Any two of intangible, perishable, variable, produced and consumed together.
Stations can do 30, 25 and 45 units an hour. Process capacity?
Show answer
25 units an hour.
A plant makes 900 units in 300 hours. Labour productivity?
Show answer
3 units per hour.
COGS $2 million, average inventory $500,000. Turnover and days of inventory?
Show answer
4 times; about 91 days.
Which layout suits shipbuilding?
Show answer
Fixed-position layout.
Name four of the lean wastes.
Show answer
Any four of overproduction, waiting, transport, overprocessing, inventory, motion, defects, unused talent.
What is the bullwhip effect?
Show answer
Small changes in customer demand becoming larger swings in orders up the chain.
Give two ways to reduce supply chain risk.
Show answer
Dual sourcing, safety stock, nearshoring, diversifying suppliers or mapping lower tiers.
What does ISO 9001 certify?
Show answer
That a firm has a documented quality management system meeting the standard.
Inventory falls by $200,000 and carrying cost is 25 %. Annual saving?
Show answer
$50,000.
Lesson quiz · 5 questions
Score 60% or more to complete this lesson.
Create a free account to save your progress, take quizzes and earn a certificate.