
AWS-113 · Lesson 11 of 12 · 18 min
Monitoring cost and quality in production
▶ Video coming soon A video version of this lesson is on the way.
Lorraine Beaudry had approved a budget for the Front Desk Helper pilot, and she had one condition. "I want to see the cost every week," she said, "broken down by application. And if something goes wrong, I want to hear about it from the dashboard, not from the invoice."
Noor nodded. "The same goes for quality," she said. "A model that was good in testing can get worse in production without anyone changing it. The questions change, the documents change, people find new ways to use it. Evaluation does not end at launch. It becomes monitoring."
This lesson covers what to monitor once a foundation model application is in use: cost, latency, usage, safety and quality. It also covers the AWS tools for each and the main ways to reduce cost without hurting quality. Everything here was planned in the sandbox for a pilot scheduled to begin in 2027.
What drives the cost of a foundation model application
With on-demand use of a managed model, the biggest variable cost is usually tokens: the number of input tokens in each prompt and the number of output tokens in each response, each with its own price per thousand tokens. Output tokens typically cost more than input tokens. Around the model sit other costs: the knowledge base's vector store, embedding documents and questions, guardrail checks, logging and storage, and the compute that runs the application itself.
Cost per interaction pulls these together. Jonah built a small model for Front Desk Helper using illustrative prices, which every real estimate must replace with the current prices for the chosen model and Region.
# Illustrative prices in USD (not real prices) per 1,000 tokens.
PRICE_IN, PRICE_OUT = 0.0008, 0.0032
questions_per_day, days = 400, 30

prompt_tokens = 450 + 4 * 220      # template + four retrieved passages
output_tokens = 120
model_cost = questions_per_day * days * (prompt_tokens / 1000 * PRICE_IN + output_tokens / 1000 * PRICE_OUT)

fixed_monthly = {"vector store": 175.00, "guardrails and logging": 40.00, "application compute": 30.00}
total = model_cost + sum(fixed_monthly.values())
interactions = questions_per_day * days

print("Model tokens per month:", round(model_cost, 2))
for k, v in fixed_monthly.items():
    print(f"{k}: {v:.2f}")
print("Total per month:", round(total, 2))
print("Cost per interaction:", round(total / interactions, 4))Model tokens per month: 17.38 vector store: 175.00 guardrails and logging: 40.00 application compute: 30.00 Total per month: 262.38 Cost per interaction: 0.0219
What this code does
It estimates the monthly cost of a retrieval assistant with illustrative prices. The model cost is questions per day times 30 days times the input and output tokens each answer uses; fixed monthly costs for the vector store, guardrails and logging, and application servers are added on top. It prints each item, the total and the cost per interaction, showing the fixed infrastructure costs more than the model itself here.
Two things stood out. The four retrieved passages made up most of the prompt, so retrieval settings had a direct effect on cost. And the fixed costs, mainly the vector store, were larger than the model cost at pilot volume. Lorraine found that reassuring: the bill would not explode if staff asked more questions, because most of it was fixed.
Monitoring with Amazon CloudWatch and invocation logs
Amazon Bedrock publishes metrics to Amazon CloudWatch, the monitoring service from AWS-103. Useful metrics include the number of invocations, invocation latency, input and output token counts, throttling and errors, and, when guardrails are used, how often they intervened. CloudWatch dashboards show these over time, and CloudWatch alarms notify the team when a value crosses a threshold, such as latency rising above three seconds or token use jumping above its normal range.
Model invocation logging in Bedrock records the requests and responses themselves, sending them to Amazon S3 or CloudWatch Logs. Logs are essential for investigating problems and for sampling outputs for review. They also contain whatever users typed, which may include personal information, so Hannah set the rules: logs encrypted with a customer managed KMS key, access limited to the evaluation team, retention of 90 days, and the sensitive information filter in the guardrail masking phone numbers before anything was logged. AWS CloudTrail separately records who changed the configuration, such as a prompt version, a guardrail or a knowledge base setting, for audit.
Tracking cost by application
Lorraine wanted costs split by application. Cost tracking on AWS, covered in AWS-104, uses cost allocation tags, AWS Cost Explorer and AWS Budgets. For Bedrock model use, teams can create application inference profiles and tag them, for example one for Night Notes and one for Front Desk Helper, so the model costs of each appear separately. A budget for each application, with an alert at 80 of every 100 dollars of the monthly amount, meant Lorraine would hear about overspending before the invoice arrived.
Monitoring quality
Quality monitoring watches for drift: a gradual change in how well the application performs. In foundation model applications drift usually comes from changes around the model rather than in it. New kinds of question appear, documents are updated or go stale, a model version is retired and replaced, or users start relying on the tool for things it was not designed for. Signals worth watching include:
- User feedback: a thumbs-up or thumbs-down on each answer, and the comments behind the thumbs-down.
- Escalations: how often staff give up and ask a manager, a direct measure of task completion.
- Guardrail interventions: a rise may mean misuse, or a rule that is too strict.
- Retrieval signals: questions where no passage scored well, which often point to a missing or outdated document.
- Scheduled re-evaluation: rerunning the test set from lesson 9 every week, and after any change to the model, prompt or knowledge base, so a drop is caught in the numbers before users feel it.
- Sampled human review: vets reading a weekly sample of Night Notes summaries, as agreed in lesson 10.
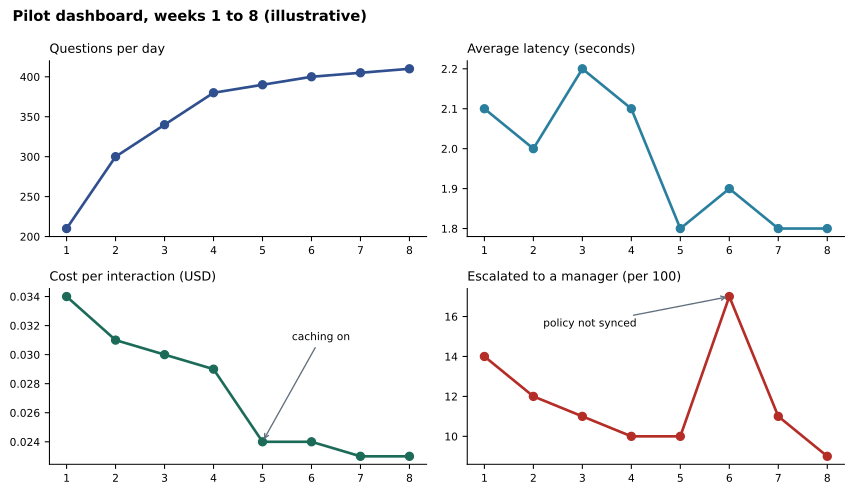
The illustrative dashboard shows why these signals matter together. In week six of the planned pilot, escalations rose. The cause in the scenario was a revised payment plan policy that had been uploaded to the bucket but not synced, so retrieval kept returning the old version. Cost and latency looked normal; only the quality signals showed the problem. The team added a step to the policy update process: every upload triggers a sync, and the evaluation test set gets a question about the change.
Reducing cost without losing quality
Once costs are visible, there are several well-known ways to reduce them. AWS describes many of these levers for Bedrock, and the exam expects you to recognize them.
| Lever | How it saves | Trade-off |
|---|---|---|
| Shorter prompts and fewer examples | Fewer input tokens per request | Must re-test that quality holds |
| Fewer or smaller retrieved passages | Fewer input tokens | Risk of missing the answer |
| Concise output instructions | Fewer output tokens, which cost more | Answers must stay complete |
| Prompt caching | Repeated prompt beginnings are reused at lower cost and latency | Only for supported models and repeated prefixes |
| Smaller model or intelligent prompt routing | Simple requests go to a cheaper model | Hard requests must still reach a capable model |
| Batch inference | Non-urgent jobs run as batches at a lower price | Results arrive later, not in real time |
| Distillation | A smaller model trained to match a larger one on the task | Setup effort; must be evaluated |
| Provisioned Throughput | Reserved capacity for steady, high volume | Committed spend; wasteful at low volume |
For Front Desk Helper, the template's instructions and examples were identical in every request, which made it a good candidate for prompt caching on a model that supports it; AWS states that caching can reduce cost substantially for repeated prefixes. The overnight reminder letters from lesson 1 were a natural fit for batch inference. Intelligent prompt routing, which sends each request to the cheaper or more capable model within a family depending on what the request seems to need, was noted for later. Each change would go through the same test set before release.
# Illustrative effect of prompt caching on Front Desk Helper input cost (invented prices).
PRICE_IN, CACHED_READ = 0.0008, 0.00008     # USD per 1,000 tokens; cached reads assumed far cheaper
monthly_requests = 12000
fixed_prefix, variable = 450, 880           # tokens: template vs retrieved passages and question
before = monthly_requests * (fixed_prefix + variable) / 1000 * PRICE_IN
after = monthly_requests * (fixed_prefix / 1000 * CACHED_READ + variable / 1000 * PRICE_IN)
print("Input cost before caching:", round(before, 2))
print("Input cost after caching: ", round(after, 2))
print("Saving:", round(before - after, 2), "per month (illustrative)")Input cost before caching: 12.77 Input cost after caching: 8.88 Saving: 3.89 per month (illustrative)
What this code does
It estimates the effect of prompt caching on input cost with invented prices. Without caching, every request pays the full price for the fixed template and the variable part; with caching, the repeated template is read from the cache at a much lower price. It prints the monthly input cost before and after and the saving.
The saving was modest because the retrieved passages, which change with every question, made up most of the prompt. Caching helps most when a long fixed prefix, such as a long instruction block or a document many questions refer to, is repeated across many requests.
Common mistakes
MistakeWatching only cost and latency.
InsteadAlso monitor quality signals: feedback, escalations, guardrail interventions, retrieval scores and scheduled re-evaluation.
MistakeLogging full prompts and responses without protection.
InsteadEncrypt logs, limit access, set retention and mask personal information before logging.
MistakeMixing every application's model costs in one line.
InsteadUse tagged application inference profiles and cost allocation tags to separate them.
MistakeCutting tokens without re-testing.
InsteadRerun the evaluation test set after every cost change to confirm quality holds.
Quotas and throttling
Amazon Bedrock applies service quotas, such as limits on requests and tokens per minute for each model in each Region. If an application exceeds them, requests are throttled: Bedrock returns an error instead of a response. Monitoring throttling metrics shows when an application is approaching its limits. Applications should retry throttled requests with increasing delays rather than immediately, and teams can request higher quotas for steady growth or consider Provisioned Throughput for high, predictable volume. Cross-Region inference can also spread requests across Regions for capacity, subject to the data residency checks from lesson 1.
Night Notes avoided the problem by design: as planned in AWS-112, it runs as a batch at the end of each shift, and batch jobs are processed as capacity allows rather than all at once. A storm night, the busiest of the year in the emergency hospital, simply means a larger batch. Front Desk Helper was different, because staff wait for each answer, so Kwame added retries with increasing delays and an alarm on throttling, and Dr. Kaur confirmed that the original call notes were always available immediately whatever happened to the summaries.
Model lifecycle
Model providers release new versions and eventually retire old ones. Bedrock publishes lifecycle information for each model, including when a version becomes legacy and when it reaches end of life. A team that depends on a model must plan for the change: watch the lifecycle dates, test the replacement version on the evaluation set well before the old one is retired, and update the prompt version and settings together. Treating a model upgrade as a release, with the same testing as any other change, avoids surprises.
Alerts need owners. Every CloudWatch alarm and budget alert in the plan named the person who would respond and what they would do first, so an alert at two in the morning would not simply sit unread until someone happened to notice it.
Worked problem
Responding to a cost alert
A budget alert fires: Front Desk Helper's model cost this week is twice its usual level, while the number of questions is unchanged. What should the team check?
Show solution
- Same number of questions but double the cost means more tokens per question: check average input and output tokens in CloudWatch.
- Check recent changes in CloudTrail: a new prompt version with more examples, or a retrieval setting that now returns more passages.
- Check the invocation logs for a sample of requests to see what grew, for example unusually long answers if a length instruction was removed.
- Roll back to the previous prompt version if it caused the increase, then rerun the test set to confirm quality.
Answer: Look for more tokens per request, trace the configuration change that caused it, confirm with logs, and roll back or fix and re-test.
Summary and key terms
- In production, monitor cost, latency, usage, safety and quality.
- Token counts drive most variable model cost, with output tokens usually priced higher; vector stores, embeddings, guardrails, logging and compute add more, and cost per interaction combines them.
- Amazon Bedrock sends metrics such as invocations, latency, token counts, errors and guardrail interventions to Amazon CloudWatch for dashboards and alarms; model invocation logging stores requests and responses, which must be protected; CloudTrail records configuration changes.
- Tagged application inference profiles, cost allocation tags, Cost Explorer and Budgets separate and control cost by application.
- Quality monitoring watches for drift with user feedback, escalations, guardrail interventions, retrieval signals, scheduled re-evaluation and sampled human review.
- Cost levers include shorter prompts and outputs, fewer passages, prompt caching, smaller models or intelligent prompt routing, batch inference, distillation and Provisioned Throughput, each followed by re-testing.
- Cost per interaction
- The total cost of an application divided by its number of interactions.
- Model invocation logging
- A Bedrock feature that records model requests and responses to S3 or CloudWatch Logs.
- Application inference profile
- A taggable Bedrock resource used to track model usage and cost per application.
- Drift
- A gradual change in an application's performance in production.
- Prompt caching
- Reusing a repeated prompt prefix across requests at lower cost and latency.
- Batch inference
- Processing many non-urgent requests together at a lower price.
- Intelligent prompt routing
- Sending each request to the most suitable model in a family to balance cost and quality.
- Provisioned Throughput
- Reserved model capacity purchased for steady, high-volume use.
Practice problems
Work each problem on paper first, then reveal the answer to check.
Which AWS service receives Bedrock metrics such as latency and token counts?
Show answer
Amazon CloudWatch.
Why must invocation logs be protected?
Show answer
They contain what users typed and the model returned, which may include personal information.
Which cost lever suits non-urgent overnight jobs?
Show answer
Batch inference.
Lesson quiz · 5 questions
Score 60% or more to complete this lesson.
Create a free account to save your progress, take quizzes and earn a certificate.