
AI-499 · Lesson 6 of 12 · 25 min
Building the system: iteration and error analysis
With baselines in place, the team moves into the main development phase: improving the system through repeated cycles of change, measurement and analysis. The most productive teams do not choose improvements by guesswork or by trying every technique they have heard of; they look closely at the errors the current system makes, group them, estimate which groups matter most, and target those. This lesson covers the development loop, building an end-to-end system early, error analysis and slice-based evaluation, data-centric improvements, model improvements and their trade-offs, managing technical debt and code quality, and deciding when to stop.
Build end to end first
The first priority after baselines is a complete, working system, however crude, that goes from raw input to useful output: data ingestion, preprocessing, model, post-processing and a simple interface or output file. An end-to-end system exposes integration problems early, such as input formats that differ from the training data, slow steps and missing post-processing, and lets the team evaluate the whole pipeline rather than one component. It also provides a demonstration for the partner early in the term, which often produces valuable feedback about what actually matters to users. Improvements are then made to individual components with the whole system as the measure.
The development loop
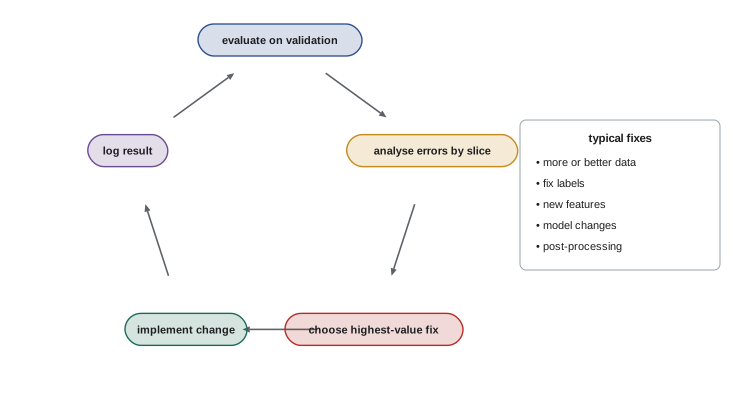
Each iteration follows a simple pattern: evaluate the current system on the validation set; analyse its errors; form a hypothesis about the most valuable improvement; implement it; re-evaluate; and record the result in the experiment log. Short loops, measured in hours or a day rather than weeks, keep progress steady. When an experiment fails to improve results, the analysis of why is still valuable and belongs in the report.
Error analysis
Error analysis means looking at individual mistakes and categorizing them. A practical method is to sample 50 to 200 validation errors, examine each one, and tag it with one or more causes: an ambiguous or wrong label, a rare input type, poor image quality, a long or unusual document, a missing feature, a confusing pair of classes, a pre-processing bug and so on. Counting the tags shows which causes account for the most errors and suggests how much each fix could gain at most. This "ceiling analysis" helps prioritize: if only 5 % of errors come from blurry images, even a perfect fix for blur gains at most 5 % of errors.
Error analysis often reveals problems no metric could, such as labels that are wrong, classes that annotators confuse, inputs that the pre-processing silently corrupts, or a category of user request the team had not anticipated. Reviewing errors with domain experts or the project partner is especially productive.
Slice-based evaluation
A single overall metric can hide large differences in performance across subsets of the data, called slices: input types, sources, regions, languages, devices, lighting conditions, demographic groups or time periods. Computing metrics per slice shows where the system is weak and whether weak slices matter to users. Small slices with poor performance may be ignored by overall metrics but be crucial in practice, for example night-time photos for a safety system, or rare document templates from important suppliers.
import numpy as np
# Error analysis by slice: overall accuracy hides weak groups
rng = np.random.default_rng(4)
slices = {"daylight photos": (700, 0.93), "indoor photos": (200, 0.84), "night photos": (60, 0.55), "blurry photos": (40, 0.48)}
total_n = sum(n for n, _ in slices.values()); total_correct = 0
print("slice".ljust(16), "n".rjust(5), "accuracy".rjust(9), "errors".rjust(7))
rows = []
for name, (n, p) in slices.items():
    correct = int(np.sum(rng.random(n) < p)); total_correct += correct
    rows.append((name, n, correct / n, n - correct))
errors_total = total_n - total_correct
for name, n, acc, err in rows:
    print(f"{name:16s} {n:5d} {acc:9.2f} {err:7d}  ({err / errors_total:.0%} of all errors)")
print(f"overall {total_n:5d} {total_correct / total_n:9.2f} {errors_total:7d}")slice n accuracy errors daylight photos 700 0.93 48 (37% of all errors) indoor photos 200 0.84 32 (24% of all errors) night photos 60 0.48 31 (24% of all errors) blurry photos 40 0.50 20 (15% of all errors) overall 1000 0.87 131
Overall accuracy of 87 % looks respectable, but night photos are correct only about half the time and blurry photos about half the time. Together these two small slices, 10 % of the data, produce nearly 40 % of all errors. Depending on users, the right response might be collecting more night and blurry images, adding image quality checks that ask users to retake poor photos, or reporting clearly that the system should not be relied on at night.
Data-centric improvements
In many projects, improving the data improves results more than changing the model. Data-centric techniques include fixing incorrect labels identified in error analysis; clarifying labelling guidelines and relabelling ambiguous classes; collecting more examples of weak slices; balancing or reweighting classes; augmenting data with realistic transformations such as rotations, crops, lighting changes, noise or paraphrases; removing duplicates and corrupted records; and creating synthetic examples for rare cases, validated against real data. Because data changes alter the validation set too, keep a fixed core validation set to measure progress consistently, and document every change in the datasheet.
Model improvements
Model-side improvements include better features, larger or pretrained models, fine-tuning instead of fixed features, ensembling several models, changing the loss function, for example class weighting or focal loss for imbalance, regularization to reduce overfitting, and post-processing such as threshold tuning, calibration (Lesson 8) and business rules. Diagnosing whether the model is underfitting or overfitting guides the choice: if training performance is also poor, the model lacks capacity or the features lack information; if training performance is much better than validation, the model is overfitting and needs more data, regularization or simpler models. Learning curves, plotting performance against training set size, show whether more data is likely to help.
| Symptom | Likely cause | Typical remedies |
|---|---|---|
| Training and validation both poor | Underfitting or uninformative features | Richer features, larger or pretrained models, longer training |
| Training good, validation poor | Overfitting | More data, augmentation, regularization, simpler model |
| Validation good, test or real use poor | Distribution shift or leakage | Re-check splits; collect representative data |
| Errors concentrated in slices | Under-represented conditions | Targeted data collection, slice-specific handling |
| Errors on near-duplicate classes | Ambiguous labels | Merge or redefine classes; improve guidelines |
Worked problem
Prioritizing fixes
A team tags 150 validation errors from a document classifier: 54 are caused by mislabelled training examples, 36 by scanned documents with poor optical character recognition (OCR), 30 by two classes that annotators often confuse, 18 by very long documents truncated at 512 tokens, and 12 by other causes. The validation set has 2,000 documents with 300 errors in total. Which fix should come first?
Show solution
- Scale tags to all errors: the sample is half the errors, so double each count.
- Label errors: about 108 of 300 errors (36 %); OCR: 72 (24 %); confused classes: 60 (20 %); truncation: 36 (12 %).
- Maximum gain from fixing label errors: about 108 errors, raising accuracy from 85 % toward 90 %.
- Effort: relabelling suspect examples is cheap; better OCR or long-document models are more expensive.
Answer: Fix label errors first, then reconsider the confused classes with the partner; better OCR and long-document handling come next if time allows.
Code quality and technical debt
Research-style code written quickly in notebooks tends to accumulate technical debt: duplicated logic, hard-coded paths, hidden state and untested functions, which make later changes slow and error-prone. Habits that keep a capstone codebase healthy include moving reusable code from notebooks into modules; writing small tests for data processing and metric functions, where bugs silently corrupt results; using configuration files rather than hard-coded parameters; code review by another team member before merging; consistent formatting with automatic tools; and a clear repository structure separating data, source code, experiments and reports. These practices pay off at the end of the term, when the system must be packaged, deployed and reproduced.
Knowing when to stop
Development could continue indefinitely, so teams need stopping rules. Stop iterating on a direction when its experiments repeatedly fail to improve the primary metric beyond noise, when the remaining errors are dominated by causes that cannot be fixed in the time available, or when the target has been met and guardrails are satisfied. Reserve the last weeks for evaluation, safety review, deployment and documentation. A well-evaluated, well-documented system that meets its target is more valuable than an unfinished one that might have been slightly better.
Working with the partner during development
Regular contact with the partner during development keeps the project grounded. Short demonstrations every two or three weeks let the partner see progress, correct misunderstandings and suggest priorities. Error analysis sessions with domain experts are especially valuable: experts can explain why certain cases are hard, identify label errors and suggest features or rules that the team would never think of. Record partner feedback and decisions in the decision log, and confirm any change of scope in writing.
Interpretability as a debugging tool
Interpretability methods help find problems during development. Feature importance for tree models, coefficient inspection for linear models, attention or saliency maps for neural networks, and examining the nearest training examples to a prediction can reveal that a model relies on spurious cues, such as a watermark in medical images, a timestamp that encodes the label, or the background in photographs. When a model appears to rely on something that should not matter, investigate the data: spurious cues often indicate leakage or a sampling problem.
Versioning models and results
As the system evolves, keep a record of each model version that was evaluated or demonstrated: the code commit, data version, configuration, evaluation results and any known issues. This makes it possible to explain later why a particular model was chosen, to roll back if a new version performs worse, and to answer reviewers' questions about how results changed over the term.
Handling class imbalance
Many capstone problems have rare positive classes, such as fraud, defects or urgent cases. Techniques for imbalance include class weighting in the loss, which makes errors on the rare class count more; resampling, by oversampling the rare class or undersampling the common one in training data only; threshold adjustment after training, using the cost-based method of Lesson 2; and choosing models and metrics that focus on the rare class, such as precision–recall curves. Evaluate on data with the real class balance, since resampled test data gives misleading precision.
Combining models with rules
Practical systems often combine learned models with rules. Rules can handle cases that are simple and certain, such as rejecting invoices with missing totals; enforce business or legal constraints, such as never automatically approving payments above a threshold; and catch known failure modes of the model. Combining them is often more reliable and easier to explain than relying on the model alone. Evaluate the combined system as a whole, and document each rule and its reason.
Tracking progress over the term
A simple chart of the primary validation metric over time, annotated with the changes that produced each step, tells the story of the development phase. It shows which changes mattered, highlights plateaus where a new direction was needed, and becomes a useful figure for the final report and presentation.
Finally, remember that development time is limited. Prioritize changes by their expected gain per hour of effort, revisit priorities after each error analysis, and protect the time reserved for evaluation, safety review and documentation. Many strong capstones stop model development a little earlier than they could have, and are better for the careful evaluation that follows.
Common mistakes
MistakePerfecting one component before the system works end to end.
InsteadBuild a crude end-to-end system first.
MistakeChoosing fixes by guesswork.
InsteadTag errors and estimate each fix's ceiling.
MistakeRelying on one overall metric.
InsteadEvaluate slices that matter to users.
MistakeChanging the validation set while measuring progress.
InsteadKeep a fixed core validation set.
MistakeLeaving all code in notebooks.
InsteadMove reusable code to tested modules with review.
Summary and key terms
- Build an end-to-end system early to expose integration problems.
- Iterate in short loops of evaluation, analysis, change and logging.
- Error analysis tags sampled mistakes to prioritize fixes.
- Ceiling analysis bounds the gain from each fix.
- Slice metrics reveal weaknesses hidden by overall scores.
- Data-centric fixes often beat model changes.
- Diagnose under- or overfitting; keep code healthy; know when to stop.
- End-to-end system
- Pipeline from raw input to useful output.
- Error analysis
- Examining and categorizing mistakes.
- Ceiling analysis
- Maximum gain if a cause of error were removed.
- Slice
- Subset of data defined by a property.
- Data-centric AI
- Improving systems by improving data.
- Augmentation
- Creating varied training examples by transformation.
- Underfitting
- Model too simple to capture patterns.
- Overfitting
- Model fitting noise in training data.
- Learning curve
- Performance against training set size.
- Technical debt
- Future cost of quick, untidy code.
Practice problems
Work each problem on paper first, then reveal the answer to check.
Why build end to end first?
Show answer
To expose integration problems and enable early feedback.
How many errors should an error analysis sample?
Show answer
About 50 to 200.
If 6 % of errors are blur, what is the most a blur fix can remove?
Show answer
6 % of errors.
What does slice evaluation reveal?
Show answer
Weak performance hidden by overall metrics.
Name three data-centric fixes.
Show answer
Relabelling, more data for weak slices, augmentation, deduplication.
Training 0.98, validation 0.75: diagnosis?
Show answer
Overfitting.
Training 0.70, validation 0.69: diagnosis?
Show answer
Underfitting or uninformative features.
What does a learning curve show?
Show answer
Whether more data is likely to help.
Name two habits that reduce technical debt.
Show answer
Modules, tests, configuration files, code review.
When should iteration stop?
Show answer
When targets are met or gains fall within noise, leaving time for evaluation and documentation.
Lesson quiz · 5 questions
Score 60% or more to complete this lesson.
Create a free account to save your progress, take quizzes and earn a certificate.