
STAT-235 · Lesson 1 of 5 · 34 min
Describing data
Engineering decisions rest on measurements, and measurements vary. No two concrete cylinders from the same truck break at exactly the same load; no two bolts from the same machine are exactly the same length; river flow changes every hour. Statistics is the toolkit for making sound decisions when data vary: summarizing what was measured, quantifying uncertainty, and judging whether a difference is real or just noise.
This course covers the statistics every engineer needs. This first chapter is about describing data: types of data and how samples are drawn, the numbers that summarize center and spread, the plots that show shape, and how to spot outliers. The running example is a set of concrete strength tests, the kind of data a site engineer reviews every week.
Populations, samples and data types
A population is the entire set of items or measurements of interest: every cubic yard of concrete placed in a bridge deck, every bolt produced this month. A sample is the part you actually measure, chosen to represent the population. Almost all engineering statistics is about using a sample to learn about a population.
Good conclusions need good samples. A random sample, where every item has an equal chance of selection, avoids systematic bias. Testing only the first bolts off the line each morning, or only the concrete from trucks that arrived on time, could give a misleading picture.
Data come in two broad types:
- Quantitative (numerical): measured values such as strength (psi), length (in) or flow (ft³/s). These may be continuous (any value in a range) or discrete (counts, such as defects per batch).
- Categorical (qualitative): labels such as pass/fail, supplier A/B/C, or failure mode.
Measures of center
The sample mean is the arithmetic average:
The median is the middle value when the data are sorted (the average of the two middle values when n is even). The mode is the most frequent value, mainly useful for categorical data.
The mean uses every value, which makes it efficient but sensitive to extreme values. The median is resistant: one wild value barely moves it. When data are skewed (for example incomes, flood flows, repair times), the mean and median differ, and the median is often the better description of a typical value.
Worked problem
Concrete cylinder strengths
Twenty 28-day cylinder tests (psi) from a 5000 psi mix are: 5250, 5580, 5060, 5950, 5470, 5700, 5190, 5860, 4870, 5530, 5370, 6140, 5310, 5770, 5090, 5640, 5420, 5930, 5220, 4260. Find the mean and median.
Show solution
- Sum = 108,610, so \(\bar{x} = 108\,610/20 = 5430.5\) psi.
- Sorted: 4260, 4870, 5060, 5090, 5190, 5220, 5250, 5310, 5370, 5420, 5470, 5530, 5580, 5640, 5700, 5770, 5860, 5930, 5950, 6140.
- With n = 20, the median averages the 10th and 11th values: \((5420 + 5470)/2 = 5445\) psi.
Answer: Mean 5430 psi, median 5445 psi. They are close, so the data are roughly symmetric, though the mean is pulled slightly down by the low value of 4260
Measures of spread
Two batches can have the same average but very different consistency, and in engineering consistency often matters as much as the average. The standard measures of spread are:
- Range: maximum minus minimum. Simple but depends only on two values.
- Sample variance and standard deviation:
Dividing by \(n - 1\) rather than n corrects for the fact that the deviations are measured from the sample mean rather than the unknown population mean, which makes \(s^2\) an unbiased estimate of the population variance. Calculators and software usually offer both: use the n − 1 version (often labeled s, STDEV.S or ddof=1) for samples.
- Coefficient of variation: \(CV = s/\bar{x}\), the spread relative to the mean, useful for comparing variability between quantities of different size.
- Interquartile range (IQR): the spread of the middle half of the data, \(Q_3 - Q_1\), resistant to outliers.
Worked problem
Spread of the strength data
Find the range, standard deviation and coefficient of variation of the twenty strengths.
Show solution
- Range: 6140 − 4260 = 1880 psi.
- Sum of squared deviations from 5430.5 is 3,563,295, so \(s^2 = 3\,563\,295/19 = 187\,542\) psi² and \(s = 433\) psi.
- \(CV = 433/5430.5 = 0.080\), or 8.0%.
Answer: s ≈ 430 psi, CV ≈ 8%. For ready-mixed concrete, standard deviations of roughly 400 to 700 psi are common, so this supplier is producing fairly consistent concrete
Worked problem
Comparing two machines
Machine A makes 50 mm pins with mean 50.02 mm and s = 0.08 mm; machine B gives mean 49.95 mm and s = 0.03 mm. The tolerance is 50.00 ± 0.15 mm. Which machine is better, and what should be done?
Show solution
- A is better centered (off by 0.02 mm) but more variable. Its values spread roughly ±3s = ±0.24 mm around 50.02, well beyond the ±0.15 tolerance.
- B is off-center by 0.05 mm but much more consistent: ±3s = ±0.09 mm around 49.95 gives 49.86 to 50.04, inside the tolerance.
Answer: B is the better machine: an offset can usually be corrected by adjusting the set-up, but excessive variation needs a more fundamental fix. Recentring B at 50.00 would leave a comfortable margin
Quartiles, box plots and outliers
Quartiles divide sorted data into four parts. \(Q_1\) is the median of the lower half, \(Q_3\) the median of the upper half. (Different software uses slightly different rules for interpolating quartiles, so small differences between programs are normal.)
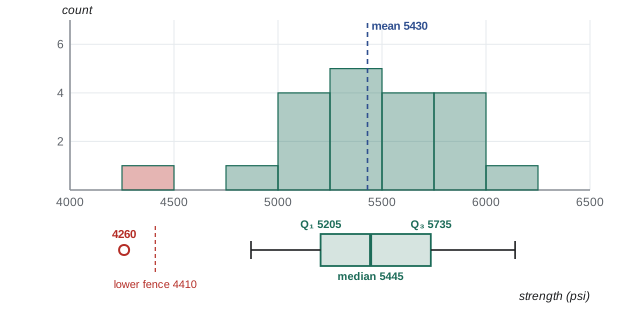
A common rule flags a value as a possible outlier if it lies more than 1.5 IQR below \(Q_1\) or above \(Q_3\). A box plot shows the quartiles as a box, the median as a line inside it, whiskers to the most extreme values within the fences, and outliers as separate points.
Worked problem
Is 4260 psi an outlier?
Use the 1.5 IQR rule on the strength data.
Show solution
- Lower half (10 values): median of 5190 and 5220, so \(Q_1 = 5205\). Upper half: median of 5700 and 5770, so \(Q_3 = 5735\).
- IQR = 530; 1.5 IQR = 795.
- Fences: \(5205 - 795 = 4410\) and \(5735 + 795 = 6530\) psi.
- 4260 is below 4410.
Answer: Yes, 4260 psi is a statistical outlier. That does not mean it should be deleted. It must be investigated: was the cylinder badly made, cured or capped, or was that load of concrete actually weak?
This is a crucial engineering point. An outlier is a question, not an error to discard. Removing inconvenient data without cause is both bad statistics and an ethical problem. In concrete practice, ACI 318 sets acceptance criteria for strength tests: every average of three consecutive tests must at least equal the specified strength f′c, and no single test may fall more than 500 psi below f′c (for f′c of 5000 psi or less; above that, more than 10% below). Here f′c = 5000 psi, so 4260 psi (740 psi below) triggers an investigation, often including cores drilled from the structure itself.
Worked problem
Sensitivity of the summaries
Suppose investigation shows the 4260 psi cylinder was damaged in handling, so the result is excluded for a documented reason. Recompute the mean, median and standard deviation of the other 19.
Show solution
- Mean: \((108\,610 - 4260)/19 = 5492\) psi (up 62).
- Median: the 10th of 19 sorted values, 5470 psi (up 25).
- Standard deviation: 343 psi (down from 433).
Answer: One value changed the standard deviation by 21% but the median by less than 0.5%. Robust summaries such as the median and IQR are valuable precisely because they do not swing with a single bad point
Seeing the shape: histograms
A histogram groups the data into bins and draws a bar for the count (or proportion) in each. It shows the shape of the distribution: where it is centered, how spread out it is, whether it is symmetric or skewed, whether it has one peak or several. A rough rule for the number of bins is Sturges' rule, \(k \approx 1 + \log_2 n\), about 5 or 6 bins for 20 values; with more data, more bins reveal more detail.
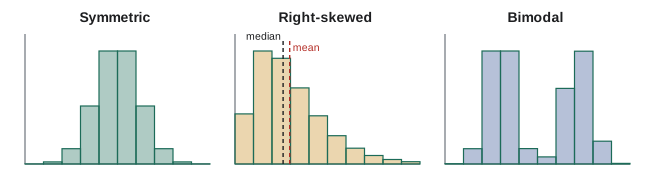
Shape carries engineering information. Many measurement errors and manufactured dimensions are roughly symmetric and bell-shaped. Flood flows, wind speeds, repair times and fatigue lives are typically right-skewed, with occasional very large values, and those extremes usually govern design. A bimodal histogram is a warning that the data mix two populations: two machines, two shifts, two suppliers or two failure modes, which should be separated and analyzed individually.
Standardizing: z-scores
A z-score expresses a value as a number of standard deviations from the mean:
It puts different quantities on a common scale. For roughly bell-shaped data, about 68% of values lie within 1 standard deviation of the mean, 95% within 2, and 99.7% within 3 (the empirical rule, made precise by the normal distribution in Lesson 3). A value with |z| above 3 is unusual.
Worked problem
How unusual is the low result?
Find the z-score of 4260 psi in the full data set.
Show solution
- \(z = (4260 - 5430.5)/433 = -2.70\).
Answer: z = −2.7: unusual, but not as extreme as it looks, because the outlier itself inflates s. Against the other 19 values (mean 5492, s 343), z = −3.6, which is clearly exceptional
Relationships between two variables
Often two quantities are measured together: strength and water-cement ratio, deflection and load, fuel use and speed. A scatter plot shows each pair as a point and reveals whether they move together. The sample correlation coefficient r (between −1 and +1) measures the strength of a linear relationship: near ±1 is strong, near 0 is weak. Lesson 5 develops this into regression. For now remember the classic warning: correlation does not by itself show that one variable causes the other, since both may be driven by a third factor.
Common mistakes
MistakeDividing by n instead of n − 1 for a sample standard deviation.
InsteadUse n − 1 (STDEV.S, ddof=1) for samples; n only when you truly have the whole population.
MistakeDeleting outliers because they are inconvenient.
InsteadInvestigate them; exclude only for a documented physical reason, and report that you did.
MistakeReporting only the mean for skewed data.
InsteadReport the median (and IQR) too, and show a histogram or box plot.
MistakeJudging a process by its mean alone.
InsteadCheck spread against the tolerance; consistency is often the harder problem.
MistakeTreating a bimodal histogram as one population.
InsteadLook for two sources (machines, shifts, suppliers) and analyze them separately.
MistakeConcluding causation from a scatter plot.
InsteadCorrelation shows association; establishing cause needs physics, experiments or careful design.
Summary and key terms
- A sample is used to learn about a population; random sampling avoids bias. Data are quantitative (continuous or discrete) or categorical.
- Center: the mean uses all values but is sensitive to extremes; the median is resistant.
- Spread: range, sample variance and standard deviation (divide by n − 1), coefficient of variation, IQR.
- Quartiles and box plots summarize distributions; the 1.5 IQR rule flags possible outliers, which must be investigated, not simply deleted.
- Histograms show shape: symmetric, skewed or bimodal, each with engineering meaning.
- z-scores standardize values; for bell-shaped data about 68%, 95% and 99.7% lie within 1, 2 and 3 standard deviations.
- Scatter plots and the correlation coefficient describe relationships, which are not proof of causation.
- Population
- The complete set of items or measurements of interest.
- Sample
- The subset actually observed, used to infer properties of the population.
- Mean
- The arithmetic average of the values.
- Median
- The middle value of sorted data.
- Standard deviation
- The typical distance of values from the mean; s for a sample.
- Coefficient of variation
- s divided by the mean, a relative measure of spread.
- Quartiles
- Values dividing sorted data into four equal parts.
- Interquartile range
- Q₃ − Q₁, the spread of the middle half of the data.
- Outlier
- A value far from the bulk of the data, flagged for investigation.
- Histogram
- A bar chart of counts of values falling in bins.
- Skewness
- Asymmetry of a distribution, with a long tail on one side.
- z-score
- The number of standard deviations a value lies from the mean.
Practice problems
Work each problem on paper first, then reveal the answer to check.
Find the mean, median and range of 12, 15, 11, 18, 14.
Show answer
Mean 70/5 = 14; sorted 11, 12, 14, 15, 18: median 14; range 7.
Find the sample standard deviation of 4, 6, 8.
Show answer
Mean 6; deviations −2, 0, 2; squares sum to 8; s² = 8/2 = 4; s = 2.
Daily water use (million gallons) over a week: 41, 43, 40, 44, 42, 75, 41. Which better describes a typical day, mean or median, and why?
Show answer
Mean 46.6, median 42. The median: the 75 (perhaps a main break or fire flow) inflates the mean.
Two labs measure the same steel: Lab A mean 62.0 ksi, s = 1.8; Lab B mean 61.3 ksi, s = 0.75. Compare their coefficients of variation.
Show answer
A: 2.9%; B: 1.2%. Lab B is more repeatable.
For data with Q₁ = 20 and Q₃ = 30, which of 3, 6, 44 and 47 are flagged by the 1.5 IQR rule?
Show answer
IQR = 10, fences 5 and 45: 3 and 47 are flagged.
A measurement has z = 1.5 in a data set with mean 120 and s = 8. What is the measurement?
Show answer
120 + 1.5 × 8 = 132.
Using ACI 318 criteria with f′c = 4000 psi, do three consecutive tests of 3850, 4210 and 4060 psi pass?
Show answer
Average 4040 ≥ 4000, and no test below 3500: they pass.
A histogram of bearing lifetimes has a long tail to the right. Will the mean be above or below the median?
Show answer
Above: the tail of long lifetimes pulls the mean up.
How many histogram bins does Sturges' rule suggest for 500 values?
Show answer
1 + log₂ 500 = 1 + 8.97 ≈ 10 bins.
Ice-cream sales and drownings are correlated. Does ice cream cause drowning?
Show answer
No. Both rise in hot weather (a confounding variable).
Lesson quiz · 5 questions
Score 60% or more to complete this lesson.
Create a free account to save your progress, take quizzes and earn a certificate.