
ROB-499 · Lesson 10 of 12 · 27 min
Demonstration and documentation
The end of a capstone compresses months of work into a few artifacts: a live demonstration, a video, a technical report, a user manual, a repository and often a poster at a public showcase. These artifacts are how examiners, partners, future students and employers will judge the project, and they deserve as much planning as any subsystem. This lesson covers planning and rehearsing a demonstration that will survive real-world surprises, recording a demonstration video, writing the technical report and user documentation, handing over the repository with an appropriate license, and presenting results honestly at a showcase.
Planning the demonstration
A demonstration is a carefully designed test performed in front of an audience. It should show the must-have requirements working, in conditions as close to the real ones as practical, within a fixed time slot. The worst demonstrations try to show everything, run long, and depend on a chain of fragile steps. The best tell a short story: the problem, the robot doing its job, the evidence that it meets its requirements, and what the team learned.
Team Tern's final demonstration took place in the department's sand pit with seeded litter, because the beach was 40 minutes away and the examiners' time was limited; a recorded field patrol at the real beach was shown alongside it. The run of show was: a two-minute introduction of the problem and partner; a live autonomous patrol of a short route, detecting and collecting three cans and reporting a piece of glass without touching it; a live protective-stop demonstration, with an examiner invited to step into the robot's path; the generated litter report on a tablet; a two-minute summary of verification results with confidence intervals; and questions. Each segment had an owner, a target time and a fallback.
Fallbacks are essential. Every live step should have a plan for failure: if the robot fails to grasp a can, the team does not retry repeatedly but says so, notes the measured success rate, and moves on; if localization fails, the team switches to a pre-taught route using odometry; if everything fails, the team shows the recorded video of the same sequence from the rehearsal. Examiners respond much better to a calm, honest recovery than to ten minutes of frantic debugging. Having the demonstration configuration frozen and tagged, batteries charged and a spare ready, and a printed checklist, prevents most failures from occurring at all.
Timing and rehearsal
Demonstrations nearly always run long. Rehearsing the full run of show at least twice, with a timer and someone playing the examiner, reveals segments that take longer than expected and transitions that waste time, such as waiting for the robot to boot. Because some segments vary, especially live robot runs, it helps to estimate the probability of overrunning the slot and to plan cuts in advance.
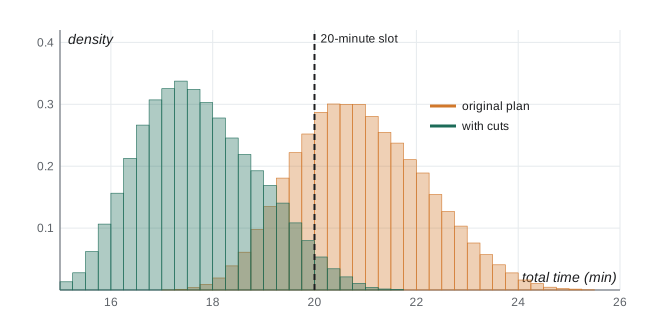
# Will the demonstration fit its 20-minute slot? Monte Carlo of segment durations (minutes)
import numpy as np
rng = np.random.default_rng(13)
N = 50_000
seg = {   # name: samples (triangular: min, mode, max) from rehearsal timings
    "set-up and boot":      rng.triangular(1.5, 2.0, 4.0, N),
    "problem introduction": rng.triangular(1.8, 2.0, 2.8, N),
    "live patrol (3 cans)": rng.triangular(4.0, 5.5, 9.0, N),
    "protective stop demo": rng.triangular(1.0, 1.5, 2.5, N),
    "report on tablet":     rng.triangular(0.8, 1.0, 1.5, N),
    "results summary":      rng.triangular(1.8, 2.0, 3.0, N),
}
questions_reserved = 5.0
total = sum(seg.values()) + questions_reserved
for slot in (20, 22):
    print(f"P(total > {slot} min) = {np.mean(total > slot):.1%}")
print(f"median {np.median(total):.1f} min, 90th percentile {np.percentile(total, 90):.1f} min")
# option: cut the patrol to two cans (saves about 1.5 min) and pre-boot the robot
total2 = total - 1.5 - (seg["set-up and boot"] - rng.triangular(0.5, 0.8, 1.2, N))
print(f"with cuts: P(total > 20 min) = {np.mean(total2 > 20):.1%}, 90th percentile {np.percentile(total2, 90):.1f} min")P(total > 20 min) = 74.5% P(total > 22 min) = 20.2% median 20.8 min, 90th percentile 22.6 min with cuts: P(total > 20 min) = 3.2%, 90th percentile 19.3 min
The simulation, based on rehearsal timings, shows a substantial chance of overrunning a 20-minute slot, mostly because of the variable live patrol and the boot time. Booting the robot before the examiners arrive and reducing the patrol to two cans, with the third can shown only if time allows, bring the risk down to an acceptable level. This is the same reasoning as the latency budget in lesson 7: design for the tail, not the average.
| Segment | Owner | Target time | Fallback |
|---|---|---|---|
| Set-up, robot pre-booted | Ben | 1 min | Spare battery; pre-booted spare computer image |
| Problem and partner | Ema | 2 min | None needed |
| Live patrol, two cans plus glass report | Dev | 5 min | Odometry-only route; then rehearsal video |
| Protective stop with examiner | Ben | 1.5 min | Test cylinder instead of a person if examiner declines |
| Litter report on tablet | Chloé | 1 min | Screenshot of the rehearsal report |
| Verification results | Ema | 2 min | Printed summary table |
| Questions | All | 5 min plus remaining time | Backup slides on detailed design |
The demonstration video
A short video, typically two to four minutes, is often required and is valuable for portfolios. It should show the robot working in its real environment, not just the lab, with clear captions or narration explaining what is happening and what the requirements were. Honesty applies to video as much as to reports: sped-up footage should be labeled, cuts should not hide failures that matter to the claims, and a video of a single successful attempt should not be presented as typical performance. A caption such as "grasp success over 40 trials: 78 % (95 % CI 62 to 88 %)" over a successful grasp tells the truth while still showing the robot at its best. The cinematography and editing courses in the Media stream, such as PHOT-440, give practical guidance on shooting and editing; for a capstone, steady framing, clean audio and good light matter more than effects.
The technical report
The final technical report is the permanent record of the project. Its audience is an engineer who was not involved: an examiner, the partner's technical staff, or a student who will continue the work next year. A common structure is: executive summary; introduction and problem statement; stakeholders and requirements; concept generation and selection; system design, covering architecture, mechanical, electrical and software design; integration; verification and validation results; safety and ethics; project management, including schedule, budget and risk performance; discussion of limitations; recommendations and future work; references; and appendices containing detailed drawings, schematics, test data, the ICD and the user manual.
Three qualities distinguish strong reports. First, traceability: every requirement appears in the verification results with its method, data and verdict, so a reader can check any claim. Second, honesty about limitations: the report states clearly what did not work, why, and what the team would do differently. Third, reproducibility: someone with the repository, the drawings and the BOM could rebuild and run the robot. Writing is easier if the team has kept the logs, decision records and test procedures described in earlier lessons; the report is then largely assembly and editing rather than reconstruction from memory.
| Report section | Key content | Common weakness |
|---|---|---|
| Executive summary | Problem, solution, key results with numbers, main limitations | Vague claims without numbers |
| Requirements | Final requirements with priority, rationale and changes | Requirements that differ from those verified |
| Design | Architecture, key decisions with rationale, budgets | Description without justification |
| Verification and validation | Each requirement: method, data, interval, verdict; user findings | Selective reporting; no uncertainty |
| Safety and ethics | Hazard log, FMEA, approvals, privacy and impacts | Generic statements not tied to the robot |
| Project management | Planned versus actual schedule and budget, risks realized | Omitted or purely positive |
| Limitations and future work | What failed and why; prioritized recommendations | Missing or defensive |
Worked problem
Writing an honest results statement
Tern grasped 31 of 40 cans in sand-pit trials (Wilson 95 % interval 62 to 88 %) against a 70 % requirement, and 6 of 24 wrappers (12 to 45 %) against a 50 % should-have. How should the executive summary report this?
Show solution
- State the measured values with sample sizes and intervals rather than only percentages.
- State the verdicts accurately: can grasping is above target on average but not demonstrated at 95 % confidence; wrapper grasping falls short.
- Give the main cause where known: flat, flexible wrappers lie flush with the sand and the two-finger gripper cannot get under them.
- Point to the recommendation: a suction or pinch-and-drag end effector for flat items.
Answer: For example: "Tern grasped 78 % of cans (31/40; 95 % CI 62 to 88 %), above the 70 % target but not yet demonstrated at 95 % confidence; wrapper grasping reached 25 % (6/24) against a 50 % goal because flat items lie flush with the sand, and a suction end effector is recommended."
User manual and handover
If the partner or a future team will use the robot, it needs documentation written for them. An operator guide covers safe use: what the robot does and does not do, the operating limits, start-up and shut-down checklists, the emergency stops, charging and battery handling, what to do when something goes wrong, and who to contact. A maintenance guide covers routine care such as cleaning the lidar window, replacing gripper fingers and checking fasteners. These documents are tested like any other deliverable: Team Tern asked a parks staff member, during validation, to follow the operator guide without help, and rewrote three steps that confused her.
Handover also includes the physical robot, spare parts, the BOM, CAD files in both native and neutral formats such as STEP, schematics, firmware and software. Agreements about who owns the robot and the IP, discussed in lesson 11, determine what can be handed over and to whom. If the robot is left with a partner, the team and university should agree in writing on its status: a research prototype, not a product, with no warranty, used under the partner's own risk assessment.
The repository and licensing
A capstone repository should allow another engineer to understand, build and run the software. It needs a README with a project overview, hardware requirements, build instructions, how to launch in simulation and on the robot, and known issues; documentation of the architecture and interfaces; test instructions; and a clear license. ROB-360 lesson 11 covered open-source licenses in detail. Permissive licenses such as MIT, BSD and Apache 2.0 allow reuse with few conditions, Apache 2.0 also including an explicit patent license; copyleft licenses such as the GPL require derived works to be released under the same terms. Most ROS 2 packages use Apache 2.0 or BSD. The team must also respect the licenses of everything it used: datasets, pretrained models, libraries and CAD models from online repositories, some of which prohibit commercial use. Before choosing a license, check the program's and partner's IP rules, as lesson 11 explains; the team may not be free to open-source everything.
If the partner is a public body, project documents it receives may be subject to state public-records laws, and US universities often have rules on depositing capstone reports in institutional repositories. Confirm with the partner and your program what can be published before posting the report or repository publicly.
Showcases and posters
Many programs end with a public showcase where teams present posters and demonstrations to faculty, industry visitors and the public. A good poster communicates the problem, the solution and the key results in the time a visitor stands in front of it, roughly a minute. It leads with a clear title and one striking image of the robot in use, keeps text short, shows results as charts with uncertainty rather than tables of numbers, and includes a QR code to the video and repository. Each team member should be able to give a 30-second, 2-minute and 5-minute version of the project story; industry visitors at showcases are often recruiters, as lesson 12 discusses.
Common mistakes
MistakeTrying to demonstrate every feature in the time slot.
InsteadDesign a short story showing the must-haves, with timed segments, owners and fallbacks.
MistakeDebugging live when a demonstration step fails.
InsteadAcknowledge the failure, cite the measured performance, switch to the fallback and move on.
MistakeRehearsing only parts of the demonstration.
InsteadRehearse the full run of show with a timer at least twice and plan cuts for the tail.
MistakeEditing the video to imply typical performance from a single success.
InsteadLabel speed-ups and state measured success rates and intervals in captions.
MistakeWriting a report that describes the design without justifying it or reporting limitations.
InsteadTrace every requirement to results, justify decisions and state limitations and recommendations honestly.
MistakePublishing the repository without checking licenses and IP rules.
InsteadChoose a license consistent with program and partner agreements and respect third-party licenses.
Summary and key terms
- A demonstration is a designed test: a short story of the must-haves, with timed segments, owners and fallbacks.
- Full rehearsals and timing analysis help design for the tail; pre-booting and planned cuts reduce overrun risk.
- Demonstration videos should show the real environment and state measured performance honestly.
- The technical report is traceable, honest about limitations and reproducible, built from logs kept during the term.
- Operator and maintenance guides are written for the actual users and tested with them.
- Handover covers the robot, spares, BOM, native and neutral CAD, schematics and code, under clear ownership terms.
- Repositories need a README, documentation, tests and a license consistent with IP agreements and third-party licenses.
- Run of show
- A timed sequence of demonstration segments with owners and fallbacks.
- Fallback
- A prepared alternative used if a live demonstration step fails.
- Feature freeze
- The point after which only verified fixes are allowed before a demonstration.
- Executive summary
- A short opening section stating the problem, solution, key results and limitations.
- Reproducibility
- The ability of another engineer to rebuild and rerun the system from the documentation.
- Operator guide
- Documentation telling users how to use a system safely, including limits and emergency procedures.
- Neutral CAD format
- A vendor-independent file format, such as STEP, for exchanging models.
- Permissive license
- A software license, such as MIT, BSD or Apache 2.0, allowing reuse with few conditions.
- Copyleft license
- A license, such as the GPL, requiring derived works to be distributed under the same terms.
- Showcase
- A public event where capstone teams present posters and demonstrations.
Practice problems
Work each problem on paper first, then reveal the answer to check.
Why did Team Tern demonstrate in the sand pit and show a field video?
Show answer
Examiner time and travel made the beach impractical; the sand pit allowed a live, controlled demonstration while the video showed real-environment performance.
Give a fallback for a localization failure during the live patrol.
Show answer
Switch to a pre-taught route using odometry, or show the rehearsal video of the same sequence.
Why plan for the 90th percentile of demonstration time rather than the median?
Show answer
Live segments vary; planning for the median gives a high chance of overrunning the slot.
Name two actions that reduced Tern's chance of overrunning the slot.
Show answer
Pre-booting the robot and reducing the live patrol from three cans to two.
How should a video show a grasp that succeeds 78 % of the time?
Show answer
Show a successful grasp with a caption stating the measured rate, sample size and interval.
List five sections of a capstone technical report.
Show answer
Any five of executive summary, problem and requirements, concept selection, design, integration, verification and validation, safety and ethics, project management, limitations, recommendations, appendices.
What makes a report reproducible?
Show answer
Enough detail in the repository, drawings, BOM, procedures and configuration records for another engineer to rebuild and rerun the system.
How should an operator guide be tested?
Show answer
Have an intended user follow it without help and revise steps that cause confusion.
Why might a team not be free to release all its code under an open-source license?
Show answer
Program or partner IP agreements, confidentiality and third-party licenses may restrict release.
What should a capstone poster lead with?
Show answer
A clear title and an image of the robot in use, followed by brief problem, solution and key results with uncertainty.
Lesson quiz · 5 questions
Score 60% or more to complete this lesson.
Create a free account to save your progress, take quizzes and earn a certificate.