
PMP-160 · Lesson 8 of 12 · 25 min
Calculation questions
Calculations make up only a small share of PMP questions, but they are among the few questions with an answer you can be certain of. Candidates commonly report seeing a handful of earned value, schedule, communication, estimating and risk calculations, often wrapped in a short scenario or shown on a graphic. This lesson collects the formulas you need, works them on Project Compass numbers, and shows the traps that wrong options are built from.
You will have an on-screen calculator and a whiteboard or scratch surface. There is no formula sheet, so the formulas below should be memorized well enough to write them down quickly when needed. Many candidates jot the key ones down early in the exam, during the first minutes or at a break, so they are ready when needed.
Earned value management
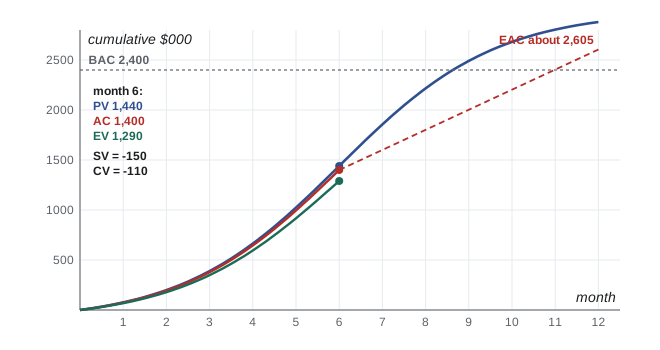
Earned value compares the planned value of work (PV), the earned value of work actually completed (EV) and the actual cost of that work (AC). The budget at completion (BAC) is the total planned value. From these come variances, indices and forecasts.
Negative variances and indices below 1.0 are unfavorable: behind schedule or over budget. A useful memory aid is that earned value always comes first: every variance starts with EV, and every index puts EV on top.
# Common PMP calculations, using Project Compass month 6 figures ($000).
BAC, PV, EV, AC = 2400, 1440, 1290, 1400
SV, CV = EV - PV, EV - AC
SPI, CPI = EV / PV, EV / AC
EAC = BAC / CPI                          # if current cost performance continues
ETC, VAC = EAC - AC, BAC - EAC
TCPI = (BAC - EV) / (BAC - AC)           # efficiency needed to finish on BAC
print(f"SV {SV}  CV {CV}  SPI {SPI:.2f}  CPI {CPI:.2f}")
print(f"EAC {EAC:.0f}  ETC {ETC:.0f}  VAC {VAC:.0f}  TCPI {TCPI:.3f}")
print(f"EAC = AC + (BAC - EV) = {AC + (BAC - EV)}  (if remaining work goes to plan)")
print()
# Communication channels when the core team grows from 8 to 11 people.
ch = lambda n: n * (n - 1) // 2
print(f"channels 8 -> 11 people: {ch(8)} -> {ch(11)}, added {ch(11) - ch(8)}")
# PERT estimate for the ceiling installation (days).
O, M, P = 8, 10, 18
print(f"PERT expected {(O + 4 * M + P) / 6:.1f} days, sigma {(P - O) / 6:.2f}")
# Expected monetary value of two risks and an opportunity ($000).
risks = [(0.30, -40), (0.10, -90), (0.25, +12)]
print(f"EMV total {sum(p * i for p, i in risks):.1f}")SV -150 CV -110 SPI 0.90 CPI 0.92 EAC 2605 ETC 1205 VAC -205 TCPI 1.110 EAC = AC + (BAC - EV) = 2510 (if remaining work goes to plan) channels 8 -> 11 people: 28 -> 55, added 27 PERT expected 11.0 days, sigma 1.67 EMV total -18.0
At month 6, Project Compass had PV $1,440,000, EV $1,290,000 and AC $1,400,000 against a BAC of $2,400,000. The schedule variance is −$150,000 and the cost variance −$110,000; SPI is 0.90 and CPI about 0.92, so the project is behind schedule and over budget. If the current cost performance continues, the estimate at completion is about $2,605,000, a variance at completion of about −$205,000. To finish on the original budget, the remaining work would need a cost performance of about 1.11, which is unlikely given a CPI of 0.92.
| EAC formula | When to use it | Project Compass result ($000) |
|---|---|---|
| BAC / CPI | Current cost performance is expected to continue | 2,605 |
| AC + (BAC − EV) | The variance was a one-off; remaining work will go to plan | 2,510 |
| AC + (BAC − EV) / (CPI × SPI) | Both cost and schedule performance will affect the remaining work | about 2,745 |
| AC + bottom-up ETC | The original estimate is no longer valid; re-estimate the remaining work | depends on the new estimate |
The scenario usually tells you which formula to use. Words such as the problem has been fixed or the overrun was caused by a single event point to AC + (BAC − EV). Words such as the trend is expected to continue point to BAC / CPI. If the question says nothing, BAC / CPI is the usual default.
Critical path and float
Schedule calculations ask for the critical path, the project duration or the float of an activity. Use the forward pass to find early start and early finish, and the backward pass to find late start and late finish. Total float is the difference between late start and early start; activities with zero total float are on the critical path.
# Forward and backward pass for a small practice network (durations in days).
acts = {  # name: (duration, predecessors)
    "A": (3, []), "B": (5, ["A"]), "C": (2, ["A"]),
    "D": (4, ["B"]), "E": (6, ["C"]), "F": (3, ["D", "E"]),
}
ES, EF = {}, {}
for a in acts:                                   # listed in a valid order
    d, pre = acts[a]
    ES[a] = max((EF[p] for p in pre), default=0)
    EF[a] = ES[a] + d
end = max(EF.values())
LS, LF = {}, {}
for a in reversed(list(acts)):
    succ = [s for s in acts if a in acts[s][1]]
    LF[a] = min((LS[s] for s in succ), default=end)
    LS[a] = LF[a] - acts[a][0]
print(f"{'Act':4}{'ES':>4}{'EF':>4}{'LS':>4}{'LF':>4}{'Float':>7}")
for a in acts:
    print(f"{a:4}{ES[a]:>4}{EF[a]:>4}{LS[a]:>4}{LF[a]:>4}{LS[a] - ES[a]:>7}")
print("critical path:", "-".join(a for a in acts if LS[a] == ES[a]), f"({end} days)")Act ES EF LS LF Float A 0 3 0 3 0 B 3 8 3 8 0 C 3 5 4 6 1 D 8 12 8 12 0 E 5 11 6 12 1 F 12 15 12 15 0 critical path: A-B-D-F (15 days)
In the practice network, the path A-B-D-F takes 15 days and has zero float, so it is critical. Activities C and E each have one day of float, because the path A-C-E-F takes 14 days. If activity E slipped by two days, it would use up its one day of float and delay the project by one day, making A-C-E-F the new critical path. Exam questions often test exactly this: what happens to the end date when a non-critical activity slips by more than its float?
Free float is the time an activity can slip without delaying the early start of any successor. In the network, E's free float is one day, because F can start on day 12 even if E finishes on day 12. C's free float is zero, because E starts as soon as C finishes, although C still has one day of total float shared along its path.
Communication channels
The number of communication channels among n people is n(n − 1)/2. Questions usually ask how many channels are added when people join. Count the project manager if the question includes them in the team.
When the Project Compass core team grew from 8 to 11 people, the channels rose from 28 to 55, an increase of 27. Three extra people almost doubled the channels. That is why adding people to a late project can slow it down, at least at first, as more coordination is needed.
Estimating
Three-point estimates use optimistic (O), most likely (M) and pessimistic (P) values. The beta or PERT estimate weights the most likely value four times; the triangular estimate takes a simple average. The standard deviation approximates uncertainty.
For the ceiling installation, with O = 8, M = 10 and P = 18 days, the PERT estimate is 11 days and σ is about 1.67 days. The triangular estimate would be 12 days. If a question asks for the three-point estimate without saying which, check the options; the PERT value is usually the one intended. Remember that for a path, expected durations add and variances (σ squared) add, not standard deviations.
Risk calculations
Expected monetary value multiplies each risk's probability by its impact and sums the results, with threats negative and opportunities positive. Decision trees use EMV to compare options.
For two threats, a 30 % chance of losing $40,000 and a 10 % chance of losing $90,000, and an opportunity with a 25 % chance of saving $12,000, the EMV is −$12,000 − $9,000 + $3,000 = −$18,000. In a decision tree, the value of each option is its cost plus the EMV of its outcomes; choose the option with the best expected value. PMP-131 worked a decision tree for the intrusive ceiling survey on Project Compass.
Other calculations you may meet
| Topic | Formula or rule | Example |
|---|---|---|
| Point of total assumption | PTA = (ceiling price − target price) / buyer share + target cost | Kiosk contract: (345 − 330) / 0.70 + 300 = 321.4 |
| Little's law | Cycle time = work in progress / throughput | 12 items in progress, 6 finished a week: 2 weeks |
| Velocity forecast | Sprints = remaining points / velocity | 62 points at 21.3: about 3 sprints |
| Payback period | Initial cost / annual net cash inflow (simple) | $300,000 / $75,000 a year: 4 years |
| Benefit-cost ratio | Present value of benefits / present value of costs | Above 1.0 means benefits exceed costs |
| Net present value | Sum of discounted cash flows | Choose the higher NPV among exclusive options |
| Cost slope for crashing | (Crash cost − normal cost) / (normal time − crash time) | Crash the critical activity with the lowest slope first |
Several of these, such as net present value and internal rate of return, are more often tested as concepts than as full calculations: which option to choose given the figures, or what a value above 1.0 means. You should be able to interpret them quickly even if you are not asked to compute them.
A routine for calculation questions
- Identify what is asked: a variance, an index, a forecast, a float, a count.
- Write down the formula before entering numbers.
- Pull exactly the values needed from the scenario or graphic, checking units and whether figures are in thousands.
- Calculate, then check the sign and size against the story. A project described as over budget should have a negative CV and a CPI below 1.
- Compare with the options. If your answer is not there, look for a likely slip, such as dividing the wrong way or using PV instead of EV.
Worked problem
An earned value question with distractors
A project has BAC $500,000. At the status date, PV is $200,000, EV $180,000 and AC $225,000. The project manager expects current cost performance to continue. What is the estimate at completion? Options: A. $455,000. B. $545,000. C. $555,556. D. $625,000.
Show solution
- CPI = EV / AC = 180,000 / 225,000 = 0.80.
- Because current performance is expected to continue, use EAC = BAC / CPI = 500,000 / 0.80 = $625,000.
- Option B, $545,000, is AC + (BAC − EV), the formula for a one-off variance. Option A subtracts the cost variance from the budget instead of adding it. Option C uses SPI instead of CPI.
- The project is over budget, so EAC should be above BAC. D is consistent with that.
Answer: D, $625,000.
Common mistakes
MistakeDividing AC by EV to get CPI.
InsteadEarned value goes on top: CPI = EV / AC.
MistakeUsing BAC / CPI when the question says the variance was a one-off.
InsteadUse AC + (BAC − EV) for atypical variances.
MistakeAdding standard deviations along a path.
InsteadAdd variances, then take the square root.
MistakeForgetting to count the project manager in communication channels.
InsteadInclude everyone the question includes.
MistakeTreating a non-critical delay as harmless whatever its size.
InsteadA slip larger than total float delays the project.
Summary and key terms
- Earned value: SV = EV − PV, CV = EV − AC, SPI = EV / PV, CPI = EV / AC; values below zero or 1.0 are unfavorable.
- Choose the EAC formula from the scenario: BAC / CPI if the trend continues, AC + (BAC − EV) for a one-off variance.
- Total float = LS − ES; zero-float activities form the critical path.
- Communication channels = n(n − 1) / 2.
- PERT estimate = (O + 4M + P) / 6 and σ = (P − O) / 6; variances add along a path.
- EMV sums probability times impact, with threats negative and opportunities positive.
- Planned value (PV)
- The authorized budget for work scheduled to be done by a point in time.
- Earned value (EV)
- The budgeted value of work actually completed.
- Actual cost (AC)
- The cost actually incurred for the work completed.
- Estimate at completion (EAC)
- The expected total cost when the project is finished.
- To-complete performance index (TCPI)
- The cost efficiency needed on remaining work to meet a target.
- Total float
- How long an activity can be delayed without delaying the project end.
- Free float
- How long an activity can be delayed without delaying any successor's early start.
- Expected monetary value (EMV)
- The probability-weighted average outcome of uncertain events.
Practice problems
Work each problem on paper first, then reveal the answer to check.
PV 100, EV 90, AC 120. What are SPI and CPI?
Show answer
SPI 0.90, CPI 0.75.
BAC 400, CPI 0.80. What is EAC if the trend continues?
Show answer
500.
BAC 400, EV 150, AC 170. What is EAC if the variance was a one-off?
Show answer
420.
How many channels does a team of 6 have?
Show answer
15.
O 4, M 6, P 14. What is the PERT estimate?
Show answer
7.
What is σ for O 4, P 14?
Show answer
About 1.67.
A non-critical activity with 3 days of float slips 5 days. What happens?
Show answer
The project is delayed by about 2 days and the path may become critical.
A 20 % chance of a $50,000 loss. What is the EMV?
Show answer
−$10,000.
What does a TCPI above 1.0 mean?
Show answer
Remaining work must be done more efficiently than planned to meet the target.
Work in progress is 18 items and throughput 6 a week. What is average cycle time?
Show answer
3 weeks.
Lesson quiz · 5 questions
Score 60% or more to complete this lesson.
Create a free account to save your progress, take quizzes and earn a certificate.