
PMP-140 · Lesson 9 of 12 · 24 min
Release planning and forecasting
Sponsors, boards and customers need to know roughly what will be delivered and when, even on an agile project. Agile teams answer with release plans and forecasts that are updated as they learn, rather than with a single fixed promise made at the start. This lesson shows how the Compass app team planned its releases, how it used velocity and simulation to forecast, and how a forecast that looked fine on averages turned out to need a scope decision.
Levels of agile planning
Agile planning happens at several horizons, sometimes pictured as an onion. At the outer layers sit the organization's strategy and portfolio, then the product vision and roadmap, then release plans, then iteration (sprint) plans and finally daily plans. Outer layers change slowly and are coarse; inner layers change often and are detailed. This is rolling wave planning in agile form: plan the near term in detail, the medium term in outline and the long term as goals.
| Level | Horizon | Typical artifact | Compass app |
|---|---|---|---|
| Vision | Years | Product vision statement | Library services in every patron's pocket |
| Roadmap | Quarters | Now, next, later themes or dated goals | Now: release 1 for Eastgate; next: release 2; later: all branches |
| Release | Weeks to months | Release goal and candidate scope, burn-up | Release 1 by the soft opening (end of sprint 9) |
| Sprint | One to four weeks | Sprint goal and sprint backlog | Sprint 7: holds queue and notifications |
| Day | One day | Updated task board | Daily scrum plan |
Roadmaps deserve care. A roadmap with exact dates for every feature for the next year looks reassuring but implies certainty the team does not have. Many organizations prefer outcome-oriented roadmaps (now, next, later) or dated goals with ranges. The Compass roadmap fixed one date firmly, the soft opening, because the lease and the opening campaign depended on it, and left the rest flexible.
Fixed date or fixed scope
A release can be planned in two basic ways. With a fixed date, the question is how much scope will be ready by then; the team forecasts a range of points it can complete and the product owner orders the backlog so the most valuable work falls inside the likely range. With fixed scope, the question is when a defined set of features will be done; the team forecasts a range of dates. Fixing both scope and date, without slack, removes the variable that agile planning relies on and usually leads to overtime, cut quality or a missed date. Release 1 of the Compass app had a fixed date and a scope that could flex.
Forecasting with velocity
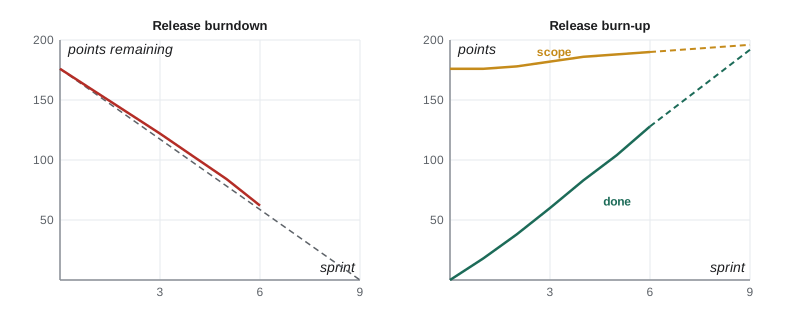
The simplest forecast divides the remaining work by average velocity. After six sprints, the Compass team had completed 128 points at velocities of 18, 20, 22, 23, 21 and 24, an average of about 21.3. Release 1 had 190 points, so 62 remained, and three sprints were left before the soft opening. The average suggested 20.7 points per sprint were needed, just under the average velocity, so on paper release 1 was on track. Many teams improve on a single average by using a range: a pessimistic velocity (the average of the three lowest sprints, here 19.7) and an optimistic one (the three highest, here 23). At 19.7 points per sprint, three sprints deliver only 59 points.
Even that range misses something PMP-130 already spotted: the backlog grows. Branch staff and patrons find new needs at every review, and on average about 7 points were added to the whole backlog per sprint, a few of them to release 1. A forecast that ignores growth is too optimistic. Burn-up charts, which show total scope as a separate line, make this visible in a way that burndown charts do not.
Burndown and burn-up charts
A burndown chart plots the work remaining against time, with an ideal line falling to zero at the end of the sprint or release. It is simple and widely used for sprints. Its weakness is that scope changes are hidden: if 10 points are added and 10 completed, the line stays flat, which looks like no progress. A burn-up chart plots completed work rising toward a separate total scope line. Progress and scope change are both visible, so stakeholders can see whether the finish line is moving. For release planning, burn-up charts are usually more informative.
Probabilistic forecasting
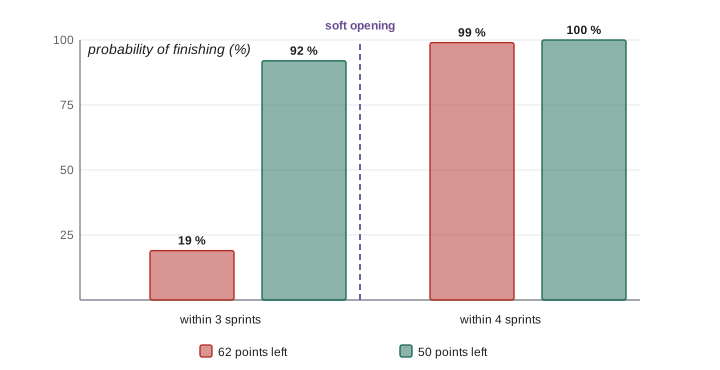
A more honest forecast treats velocity and scope growth as uncertain and simulates many possible futures. In a Monte Carlo forecast, the computer repeatedly samples a velocity from the team's history and a scope addition from recent growth for each future sprint, until the remaining work reaches zero, and records how many sprints that took. After thousands of trials, the result is a probability for each possible finish. The Compass team ran this for release 1 with 62 points left, and for an alternative in which the product owner moved 12 points of lower-priority stories to a release 1.1 shortly after opening.
# Monte Carlo release forecast for the Compass app, using past sprint velocities.
import random
random.seed(140)
velocities = [18, 20, 22, 23, 21, 24]
growth = [0, 0, 2, 4, 6]   # points added to release 1 per sprint (sampled from history)
trials = 10000

def forecast(remaining):
    needed = []
    for _ in range(trials):
        left, n = remaining, 0
        while left > 0:
            left += random.choice(growth) - random.choice(velocities)
            n += 1
        needed.append(n)
    return needed

for remaining in (62, 50):
    needed = forecast(remaining)
    within = [sum(1 for n in needed if n <= k) / trials for k in (3, 4)]
print(f"{remaining} points left: P(done in 3 sprints) {within[0]:.0%}, in 4 sprints {within[1]:.0%}")62 points left: P(done in 3 sprints) 19%, in 4 sprints 99% 50 points left: P(done in 3 sprints) 92%, in 4 sprints 100%
The averages had said "on track", but once velocity variation and scope growth are included, the chance of finishing all 62 points in the three sprints left is only about one in five. With 50 points left, it rises to about nine in ten. That difference is the information the product owner needs. Amara moved renewals with their business rules (12 points) to release 1.1, scheduled two weeks after the soft opening, after confirming with branch staff that they could renew items at the desk in the meantime. The sponsor was told plainly: release 1 without renewals is very likely by the soft opening; renewals follow two weeks later.
Probabilistic forecasts can also be built from throughput (items finished per week) rather than points, which suits Kanban teams and teams that split work to similar sizes. The principle is the same: use the team's actual history, include variability and scope growth, and express the result as probabilities. Note that the simulation is only as good as its assumptions; if the team changes size or the work changes character, past data predicts less well and the forecast needs revisiting.
Communicating forecasts
Forecasts should be communicated in a form people can use. "85 % likely by 12 March" or "we expect between 55 and 65 points by the soft opening" is more useful than a single date with hidden assumptions. Always say what the forecast assumes (team size, scope growth, no major blockers) and when it will be updated. Stakeholders who are used to fixed predictive dates may find ranges uncomfortable at first; showing them the burn-up every sprint, and how the forecast tightened, builds trust faster than a confident date that later slips.
| Weak statement | Better statement |
|---|---|
| Release 1 will be done on time. | Without renewals, release 1 is about 90 % likely by the soft opening; renewals follow about two weeks later. |
| The team needs to speed up. | At current velocity and scope growth, the release needs about 12 fewer points or one more sprint. |
| We will deliver everything on the list. | The items above this line on the backlog are likely; those below are possible if things go well. |
| The date is fixed, so the scope is fixed too. | The date is fixed; the product owner will order scope so the most valuable items fall inside the likely range. |
Releasing more often
Modern software practices make releases cheaper and more frequent. Continuous integration merges and tests changes many times a day; continuous delivery keeps the product always releasable; continuous deployment releases every passing change automatically. Feature flags let a team deploy code with a feature switched off and turn it on for a pilot group or at a chosen moment, separating deployment from release. For the Compass app, feature flags meant the team could deploy release 1 code a week before the soft opening, test it with staff in production and switch it on for patrons at opening.
Releasing often changes the shape of release planning. Instead of large releases planned months ahead, the team ships small changes continuously and uses release planning mainly for coordinated launches, such as the soft opening, where marketing, training and the branch opening all line up. In a hybrid project, those coordinated launches are exactly the integration points with the predictive plan.
Worked problem
The sponsor wants a date
At month 5, the library board asks when release 2 (room booking and event sign-up, 72 points plus whatever is added) will be available. The team's velocity has averaged 21 points per sprint, but the room booking integration depends on a vendor interface that is not yet built. What should the project manager tell the board?
Show solution
- A naive forecast is 72 / 21 ≈ 3.4 sprints, about seven weeks after release 1.1, but it ignores scope growth and the vendor dependency.
- Run a probabilistic forecast including scope growth, which might show, say, 4 to 6 sprints for 80 % confidence.
- Flag the vendor interface as a dependency with its own date and risk; if the vendor is late, room booking moves regardless of team velocity.
- Give the board a range with assumptions, show what could be delivered earlier (event sign-up does not depend on the vendor) and commit to updating the forecast each sprint.
Answer: Give a probabilistic range with stated assumptions, highlight the vendor dependency, offer to release event sign-up first, and update every sprint.
Buffers and commitments
When a date really is fixed, teams sometimes plan an explicit buffer instead of, or as well as, flexible scope. A scope buffer reserves a share of the release for should-have and could-have items that can be dropped if needed, which is what MoSCoW's guidance on must haves effectively does. A time buffer, such as a stabilization sprint before a launch, protects a coordinated event such as the soft opening from late surprises. Buffers should be visible and owned, not hidden padding in individual estimates. The Compass release plan showed the 12 points of renewals as the scope buffer for release 1 from the start, which made the eventual decision to move them quick and uncontroversial.
Common mistakes
MistakeForecasting from average velocity alone.
InsteadInclude variability and scope growth; use ranges or Monte Carlo.
MistakeUsing a burndown chart for release reporting when scope changes often.
InsteadUse a burn-up chart so scope change is visible.
MistakeFixing both scope and date with no slack.
InsteadFix one and let the other flex, or hold explicit buffers.
MistakeGiving a single date without assumptions.
InsteadState probabilities, assumptions and when the forecast will be updated.
MistakeTreating every deployment as a release decision.
InsteadSeparate deployment from release with practices such as feature flags.
Summary and key terms
- Agile planning has layers from vision and roadmap to release, sprint and daily plans.
- Releases are planned with a fixed date and flexible scope, or fixed scope and a forecast date.
- Velocity forecasts should use ranges and account for scope growth.
- Burndown charts hide scope change; burn-up charts show it.
- Monte Carlo forecasts use historical velocity or throughput to give probabilities.
- In the Compass case, moving 12 points raised the chance of hitting the soft opening from about 19 % to about 92 %.
- Continuous delivery and feature flags make releases smaller and more frequent.
- Product roadmap
- A high-level view of planned product goals or themes over time.
- Release plan
- A plan for a release's goal, likely scope and timing, updated as work progresses.
- Velocity
- The amount of work, usually in story points, a team completes per iteration.
- Burndown chart
- A chart of remaining work over time.
- Burn-up chart
- A chart of completed work rising toward a separate total scope line.
- Monte Carlo forecast
- A simulation that samples historical performance to estimate probabilities of finishing by given dates.
- Feature flag
- A switch that lets deployed code be turned on or off without redeploying.
- Continuous delivery
- Keeping the product always in a releasable state.
Practice problems
Work each problem on paper first, then reveal the answer to check.
What was the Compass team's average velocity after six sprints?
Show answer
About 21.3 points.
Why can a burndown chart be misleading?
Show answer
Scope additions are hidden, so progress can look flat.
What inputs does a Monte Carlo velocity forecast sample?
Show answer
Historical velocities (and scope growth).
What was the chance of finishing 62 points in three sprints?
Show answer
About 19 %.
What did the product owner move to release 1.1?
Show answer
Renewals with their business rules (12 points).
What is the difference between deployment and release when using feature flags?
Show answer
Code can be deployed with the feature off, and released later by switching it on.
Name the planning levels from outermost to innermost.
Show answer
Strategy, portfolio, vision, roadmap, release, sprint, day.
Why avoid fixing scope and date together?
Show answer
It removes the variable agile planning uses to absorb uncertainty.
What should accompany any forecast?
Show answer
Its assumptions and when it will be updated.
Which forecast measure suits a Kanban team?
Show answer
Throughput (items per period).
Lesson quiz · 5 questions
Score 60% or more to complete this lesson.
Create a free account to save your progress, take quizzes and earn a certificate.