
PMP-140 · Lesson 10 of 12 · 25 min
Agile metrics and information radiators
Agile teams measure to learn and to make decisions, not to grade people. The right metrics make the state of the work visible to the team and its stakeholders, show where flow is blocked and, most importantly, show whether the product is delivering the outcomes it was built for. The wrong metrics, or the right ones used the wrong way, encourage gaming and erode trust. The second edition of PMI's Agile Practice Guide expands its measurement guidance beyond counting output to include flow metrics, the Goal Question Metric approach and objectives and key results. This lesson follows that broader view.
Principles of agile measurement
A few principles separate useful agile metrics from harmful ones. Measure the team and the system, not individuals. Prefer measures of outcomes and value over measures of activity. Use empirical data (what actually happened) rather than estimates of percent complete. Look at trends rather than single values. Make the measures visible to everyone, and let the team use them to improve. And remember Goodhart's law, usually summarized as "when a measure becomes a target, it ceases to be a good measure": if managers set velocity targets, teams will inflate their estimates, and velocity will rise while real output does not.
| Category | Examples | Question answered |
|---|---|---|
| Delivery progress | Burn-up, burndown, velocity, release forecast | Are we on course for the release? |
| Flow | Cycle time, lead time, throughput, WIP, work item age, CFD | How smoothly does work move? |
| Quality | Escaped defects, defect trends, test automation coverage, change failure rate | Is the product getting better or worse? |
| Outcomes and value | Adoption, task success, patron satisfaction, business results | Is the product achieving its purpose? |
| Team health | Health checks, retrospective actions completed, sustainable pace | Can the team keep going and improve? |
Velocity: useful, but only to the team
Velocity is the number of story points completed per sprint. It helps the team decide how much to take into a sprint and helps forecast releases, as lessons 4 and 9 showed. It is not a productivity measure. It cannot be compared across teams, it changes when team membership changes, and it rewards inflating estimates. Only fully done work counts: partially finished stories contribute nothing to velocity in the sprint in which they were not finished. A steady or slowly rising velocity suggests a stable team; a falling velocity is a prompt for the team to look for causes, such as technical debt, interruptions or unclear stories, not a reason to apply pressure.
Flow metrics
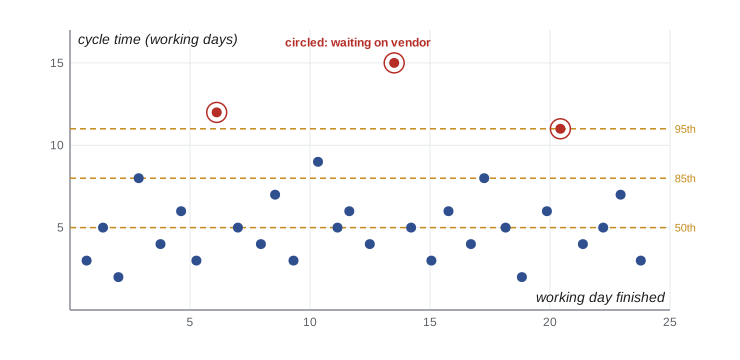
Flow metrics, introduced in lesson 5, are increasingly used by Scrum teams as well as Kanban teams. They are based on timestamps of when work started and finished, so they need no estimates. A cycle time scatterplot shows each finished item as a dot, plotted by its completion date and how long it took, with percentile lines. These percentiles support a simple service level expectation, such as "85 % of items finish within eight working days", which is often more useful to requesters than any estimate.
# Cycle times (working days) of the last 30 items finished on the kiosk integration board.
cycle = [3, 5, 2, 8, 4, 6, 3, 12, 5, 4, 7, 3, 9, 5, 6, 4, 15, 5, 3, 6,
         4, 8, 5, 2, 6, 11, 4, 5, 7, 3]
s = sorted(cycle)
def pct(p):
    k = max(0, round(p / 100 * len(s)) - 1)
    return s[k]
print(f"Items: {len(s)}  mean {sum(s) / len(s):.1f} days")
for p in (50, 85, 95):
    print(f"{p}th percentile: {pct(p)} days")
print(f"Throughput: {len(s) / 5:.0f} items per week over 5 weeks")Items: 30 mean 5.7 days 50th percentile: 5 days 85th percentile: 8 days 95th percentile: 11 days Throughput: 6 items per week over 5 weeks
Half the items finished within five working days and 85 % within eight, but a few outliers took 11 to 15 days. When the team examined those outliers, all three were waiting on the kiosk vendor, the same bottleneck the CFD showed in lesson 5. The team now tells requesters that a standard item will very likely be done within eight working days, and flags vendor-dependent items as likely to take longer.
Quality metrics
Escaped defects, the defects found after an increment is released, are a direct indicator of quality and of the effectiveness of the definition of done. Defect trends matter more than counts; a steady rise suggests growing technical debt. In software teams, four delivery measures popularized by the DevOps Research and Assessment (DORA) program are widely used: deployment frequency, lead time for changes, change failure rate and time to restore service. They balance speed and stability, so a team cannot look good by deploying recklessly.
Measuring outcomes and value
Output, the features delivered, is not the same as outcome, the change in behavior or results the features were meant to cause. A team can deliver every planned feature and still fail if patrons do not use the app. Outcome measures tie the work back to the product goal. For the Compass app, the library defined a few: the share of holds placed through the app rather than at the desk, the share of app sessions in which a patron completed the task they started, and a short in-app satisfaction rating.
Two structured approaches help choose such measures. Goal Question Metric (GQM) starts from a goal, asks questions that would show whether the goal is being met and only then picks metrics that answer those questions. Objectives and key results (OKRs) pair a qualitative objective with a small number of measurable key results, usually reviewed quarterly. Both guard against measuring what is easy rather than what matters.
| Goal | Question | Metric |
|---|---|---|
| Patrons use the app for holds instead of the desk | What share of holds come through the app? | Holds placed in the app as a percentage of all Eastgate holds, monthly |
| Patrons can complete tasks without help | Do patrons finish what they start? | Task completion rate for search, hold and sign-in flows |
| Patrons are satisfied with the app | How do patrons rate their experience? | Average in-app rating and themes from comments |
| The app is accessible to everyone | Can patrons using assistive technology complete core tasks? | Results of quarterly testing with screen reader users |
Earned value on agile work
Sponsors used to earned value sometimes ask for it on agile work too. A simple adaptation, often called AgileEVM, treats the release as the scope. Planned value is the release budget multiplied by the share of planned sprints elapsed; earned value is the release budget multiplied by the share of release points completed; actual cost is what has been spent. For the Compass app, the release 1 work had a budget of $150,000 over nine sprints. After six sprints, planned value is 6/9 of $150,000, or $100,000. Earned value is 128/190 of $150,000, about $101,000. If $108,000 has been spent, SPI is about 1.01 and CPI about 0.94.
AgileEVM can help integrate agile work into a hybrid project's cost reporting, which is exactly how the Compass project manager used it in the monthly board pack (lesson 12). Its limits are important: it assumes release scope in points is stable, which it rarely is, and it says nothing about whether the delivered features are valuable. Use it as a bridge for governance, alongside burn-up charts and outcome measures, not instead of them.
Information radiators
An information radiator is a large, highly visible display that shows the current state of the work to anyone passing by, without them having to ask or log in: a physical task board, a burn-up chart on the wall, a dashboard on a screen in the team area. The term comes from Alistair Cockburn, who contrasted radiators with information "refrigerators" hidden in tools and reports. Radiators support transparency and invite conversation; when the branch manager walked past the Compass board and saw the room booking spike marked as blocked, she offered to call the vendor's account manager herself.
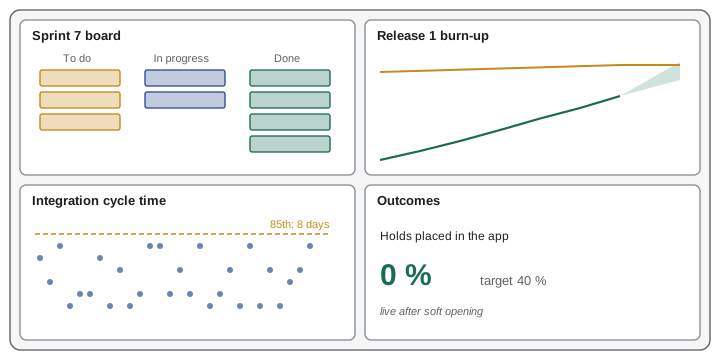
For distributed teams, digital boards and dashboards play the same role, as long as they are easy to find, always current and simple enough to read at a glance. A radiator overloaded with twenty charts radiates nothing. The Compass team's dashboard shows four things: the sprint goal and task board, the release burn-up with forecast, cycle time for the integration board and the outcome measures once the app is live.
Team health
Sustainable delivery depends on the team's health. Some teams run short, regular health checks in which members rate areas such as clarity of purpose, pace, teamwork, learning and support, and discuss trends at retrospectives. Others track how many retrospective actions are actually completed. These measures belong to the team. If they are reported upward and used to compare teams, people stop answering honestly and the measure loses its value.
Worked problem
A velocity target
The development firm's director sees that the Compass app team's velocity is about 21 points per sprint and proposes a contractual target of 25 points per sprint, with a bonus if it is met. The library's sponsor likes the idea because it sounds like accountability. What should the project manager advise?
Show solution
- Story points are the team's own relative estimates; a target invites the team to inflate estimates, so velocity rises without more value (Goodhart's law).
- Velocity also excludes quality and value; a team pushed to hit a points target may cut testing or accessibility.
- Better measures for the contract and the sponsor are outcomes (holds through the app, task completion), quality (escaped defects) and delivery of release goals by agreed dates.
- The time and materials contract with a ceiling already caps cost; incentives, if any, should be tied to outcomes the library cares about.
Answer: Advise against a velocity target; propose outcome, quality and release-goal measures instead, and keep velocity as the team's planning tool.
Reading agile charts in exam questions
Several exam questions show or describe a chart and ask what it means. A few patterns cover most of them. On a burndown, a line above the ideal means the team is behind; a flat stretch means no work finished or scope added at the same rate as work finished; a sudden drop near the end often means stories were split or removed. On a burn-up, a rising scope line shows growth that may push the finish out. On a CFD, widening bands mean growing queues and flat bands mean nothing moving. On a cycle time scatterplot, a rising trend suggests worsening flow and isolated high dots point to blockers worth investigating. In every case, the right next step is usually to make the pattern visible to the people who can act on it and investigate the cause with the team, not to demand faster work.
| Chart pattern | Likely meaning | Sensible next step |
|---|---|---|
| Burndown flat for several days | No work finished, or scope added as fast as work finished | Check for blockers and scope changes with the team |
| Burn-up scope line rising steeply | Scope growth | Product owner reviews release scope or date |
| CFD band widening | Bottleneck in that stage | Investigate the stage; consider WIP limits |
| Scatterplot trending upward | Flow is getting slower | Look at WIP, item size and blockers |
Common mistakes
MistakeUsing velocity as a productivity target or comparing teams by it.
InsteadKeep velocity as the team's planning tool; measure outcomes and flow for management.
MistakeCounting partially done stories in velocity.
InsteadOnly items meeting the definition of done count.
MistakeMeasuring output only.
InsteadAdd outcome measures tied to the product goal.
MistakeHiding metrics in tools only managers open.
InsteadUse visible information radiators the whole team and stakeholders can see.
MistakeReporting team health scores upward to rank teams.
InsteadKeep health measures with the team for its own improvement.
Summary and key terms
- Agile metrics should measure systems and outcomes, use empirical data and be visible.
- Goodhart's law: targets distort measures; velocity is a planning aid, not a productivity score.
- Flow metrics (cycle time, throughput, WIP, age) support service level expectations without estimates.
- Quality metrics include escaped defects and the DORA delivery measures.
- Outcome measures, chosen with GQM or OKRs, show whether the product achieves its purpose.
- AgileEVM adapts earned value to releases but assumes stable scope.
- Information radiators make the state of work visible to everyone.
- Goodhart's law
- When a measure becomes a target, it ceases to be a good measure.
- Escaped defect
- A defect found after an increment has been released.
- Service level expectation
- A forecast such as "85 % of items finish within eight days", based on cycle time data.
- Outcome
- The change in behavior or results that delivered features are meant to produce.
- Goal Question Metric
- An approach that derives metrics from goals through the questions they raise.
- Objectives and key results
- A qualitative objective paired with a few measurable key results.
- AgileEVM
- An adaptation of earned value that uses release points completed as the measure of earned value.
- Information radiator
- A large, visible display of the current state of the work.
Practice problems
Work each problem on paper first, then reveal the answer to check.
What does Goodhart's law warn about?
Show answer
Turning a measure into a target distorts it.
Do partially done stories count toward velocity?
Show answer
No.
What was the 85th percentile cycle time on the integration board?
Show answer
8 working days.
Name the four DORA measures.
Show answer
Deployment frequency, lead time for changes, change failure rate, time to restore service.
What is the difference between output and outcome?
Show answer
Output is what is delivered; outcome is the change in behavior or results it causes.
In AgileEVM, how is earned value calculated?
Show answer
Release budget times the share of release points completed.
What were the Compass app SPI and CPI after six sprints?
Show answer
About 1.01 and 0.94.
What is an information radiator?
Show answer
A large, visible display of the current state of the work.
How does GQM choose metrics?
Show answer
From goals, through questions that show whether goals are met.
Why keep team health scores within the team?
Show answer
Reporting them upward to compare teams discourages honest answers.
Lesson quiz · 5 questions
Score 60% or more to complete this lesson.
Create a free account to save your progress, take quizzes and earn a certificate.