
PET-440 · Lesson 4 of 12 · 21 min
Water influx and abnormally pressured reservoirs
Ethan's p/z analysis of the Oriskany sandstone pool assumed a volumetric tank. Farid is not ready to accept that. The Oriskany sandstone sits on a regional water-bearing sandstone, and the gas-water contact covers most of the pool's base. “Water drive is the most common way a p/z plot lies to you,” he says. “And it lies most convincingly early, when the points still look straight.” The second half of the lesson deals with the opposite case, a reservoir whose pressure is far above hydrostatic, like the Marcellus under the Ten Mile Ridge block. Both break the simple straight line, in different directions.
The general gas material balance
When water flows into the gas zone from an aquifer, the pore volume available to gas shrinks. Adding water influx W_e, produced water W_p and the expansion of connate water and rock to the volumetric balance gives the general gas material balance:
The left side is the reservoir volume of everything withdrawn. On the right, the first term is the expansion of the remaining gas, the second the expansion of connate water and the shrinkage of pore volume as pressure falls, and the third the water that has entered from the aquifer. For a normally pressured reservoir the middle term is tiny compared with gas expansion, because gas compressibility is a hundred times larger than water or rock compressibility. Water influx, however, can be large.
How water drive bends the p/z plot
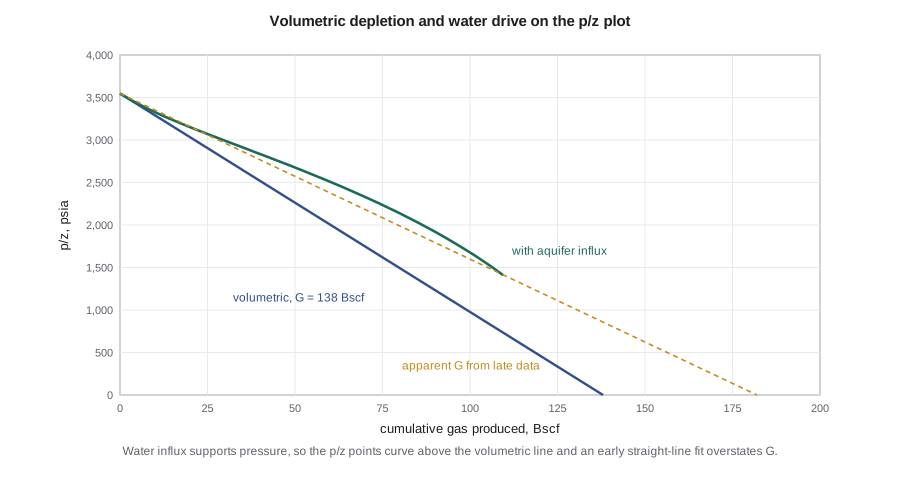
Water influx replaces some of the withdrawn volume, so the pressure falls more slowly than in a volumetric tank. On the p/z plot the points lie above the volumetric line, at first only slightly and then increasingly. In a strong water drive the pressure may barely fall at all. The danger is in the middle ground. With a moderate aquifer, the first few points look almost straight, but their slope is too shallow, and the extrapolation gives a gas in place that is too high. Engineers who book reserves on such a line later find that the water arrives at the wells long before the p/z line said the gas would run out.
Several diagnostics catch water drive earlier than the p/z plot. The Cole plot, borrowed from oil material balance, plots F/E_g, the reservoir withdrawal divided by the gas expansion per unit of gas in place, against cumulative production. For a volumetric reservoir F/E_g is constant and equals G; with water influx it rises with time. The Havlena-Odeh form of the balance, F = G E_g + W_e, plotted as F/E_g against W_e/E_g for an assumed aquifer model, gives a straight line with intercept G and slope 1 when the aquifer model is right. Rising water-gas ratios at structurally low wells, and pressure gauges in observation wells in the aquifer, are direct evidence.
Aquifer models
Water influx is calculated with an aquifer model that relates the influx to the pressure history at the gas-water contact. The pot aquifer, the simplest, assumes the aquifer is small and in instant pressure equilibrium with the reservoir, so W_e = (c_w + c_f) W_i Δp, where W_i is the aquifer water volume. It suits small aquifers only. The van Everdingen-Hurst model (1949) solves the radial diffusivity equation for the aquifer and superposes the response to each pressure step at the contact; it is rigorous for an infinite or bounded radial or linear aquifer, but it needs a convolution over the whole pressure history.
Fetkovich's 1971 model is the practical compromise used in most material balance software. It treats the aquifer as a finite tank connected to the reservoir through a productivity index J, and assumes pseudo-steady-state flow from aquifer to reservoir. Over a time step Δt, with average aquifer pressure p̄_a and average reservoir boundary pressure p̄_r:
Here W_ei is the maximum encroachable water, the water that would enter if the aquifer pressure fell from p_i to zero, and the aquifer pressure falls in proportion to the water it has given up. Two parameters, W_ei and J, are fitted to the pressure history. The Fetkovich model reproduces the van Everdingen-Hurst results well for most finite aquifers and is easy to step forward in time.
# Water influx: a gas tank with a Fetkovich aquifer, compared with volumetric depletion,
# and the Ramagost-Farshad correction for an abnormally pressured reservoir.
import math
SI = False     # True: metric units, False: oilfield units
def sutton(gg):
    return 169.2 + 349.5 * gg - 74.0 * gg ** 2, 756.8 - 131.07 * gg - 3.6 * gg ** 2

def z_dak(Tpr, ppr):
    """Dranchuk-Abou-Kassem z-factor by fixed-point and Newton iteration."""
    A = [0.3265, -1.0700, -0.5339, 0.01569, -0.05165, 0.5475, -0.7361, 0.1844, 0.1056, 0.6134, 0.7210]
    c1 = A[0] + A[1] / Tpr + A[2] / Tpr ** 3 + A[3] / Tpr ** 4 + A[4] / Tpr ** 5
    c2 = A[5] + A[6] / Tpr + A[7] / Tpr ** 2
    c3 = A[8] * (A[6] / Tpr + A[7] / Tpr ** 2)
    def f(z):
        r = 0.27 * ppr / (z * Tpr)
        return z - (1 + c1 * r + c2 * r ** 2 - c3 * r ** 5 + A[9] * (1 + A[10] * r ** 2) * r ** 2 / Tpr ** 3 * math.exp(-A[10] * r ** 2))
    z = 1.0
    for _ in range(100):
        d = (f(z + 1e-7) - f(z)) / 1e-7
        zn = z - f(z) / d
        if abs(zn - z) < 1e-10: return zn
        z = zn
    return z

gg, T_R, pi = 0.65, 160 + 459.67, 3100.0
Tpc, ppc = sutton(gg)
z = lambda p: z_dak(T_R / Tpc, p / ppc)
Bg = lambda p: 0.02827 * z(p) * T_R / p / 5.615          # rb/scf
G = 138e9; Bgi = Bg(pi)
Wei, J = 1.5e8, 40.0            # encroachable water (bbl) and aquifer productivity index (bbl/d/psi)
q, dt = 30e6, 91.25             # gas rate scf/d, time step days

def step(p_old, Gp, We_old, pa):
    """Solve G(Bg - Bgi) + We = Gp*Bg for the new tank pressure with a Fetkovich influx step."""
    def resid(p):
        dWe = Wei / pi * (pa - (p_old + p) / 2) * (1 - math.exp(-J * pi * dt / Wei))
        return G * (Bg(p) - Bgi) + We_old + dWe - Gp * Bg(p), dWe
    lo, hi = 100.0, p_old
    for _ in range(80):
        mid = (lo + hi) / 2
        if resid(mid)[0] > 0: lo = mid
        else: hi = mid
    return mid, resid(mid)[1]

rows = []
# volumetric pressure from p/z = (pi/zi)(1 - Gp/G), solved by bisection
def p_volumetric(Gp):
    target = pi / z(pi) * (1 - Gp / G); lo, hi = 50.0, pi
    for _ in range(80):
        mid = (lo + hi) / 2
        if mid / z(mid) > target: hi = mid
        else: lo = mid
    return mid
p_w, We, pa = pi, 0.0, pi
for k in range(1, 41):
    Gp = q * dt * k
    p_new, dWe = step(p_w, Gp, We, pa)
    We += dWe; pa = pi * (1 - We / Wei); p_w = p_new
    if k % 8 == 0: rows.append((k * dt / 365, Gp, p_volumetric(Gp), p_w, We))
f = (lambda v: v / 0.145038) if SI else (lambda v: v)
print(" year  Gp       p/z volumetric  p/z water drive  We" + ("   (kPa, 10^9 m3, 10^6 m3)" if SI else "   (psia, Bscf, MMbbl)"))
for yr, Gp, pv, pw, we in rows:
    g = Gp * 0.0283168 / 1e9 if SI else Gp / 1e9
    w = we * 0.158987 / 1e6 if SI else we / 1e6
    print(f"{yr:5.0f} {g:7.2f}  {f(pv / z(pv)):10,.0f}  {f(pw / z(pw)):12,.0f}  {w:8.2f}")
# apparent gas in place from a straight line through the first and last water-drive points
yr, Gp, pv, pw, we = rows[-1]
Gapp = Gp / (1 - (pw / z(pw)) / (pi / z(pi)))
print(f"Apparent OGIP from the late p/z point: {Gapp * 0.0283168 / 1e9:.2f} x 10^9 m3 (true {G * 0.0283168 / 1e9:.2f})" if SI else
      f"Apparent OGIP from the late p/z point: {Gapp / 1e9:.0f} Bscf (true {G / 1e9:.0f})")

# Abnormal pressure: Ramagost-Farshad correction of p/z with effective compressibility
cw, cf, swi = 3.0e-6, 15e-6, 0.22
ce = (cw * swi + cf) / (1 - swi)
pi2 = 31000 * 0.145038 if SI else 4500.0; Tpc2, ppc2 = sutton(0.74); T2 = 190 + 459.67
z2 = lambda p: z_dak(T2 / Tpc2, p / ppc2)
print(f"Effective compressibility {ce * 145.038:.4f} 1/MPa" if SI else f"Effective compressibility {ce:.2e} 1/psi")
for pin in ([31000, 27500, 24000, 20500] if SI else [4500, 4000, 3500, 3000]):
    p = pin * 0.145038 if SI else pin
    raw = p / z2(p); corr = raw * (1 - ce * (pi2 - p))
print(f" p {f(p):7,.0f} p/z {f(raw):7,.0f} corrected {f(corr):7,.0f}") year Gp p/z volumetric p/z water drive We (psia, Bscf, MMbbl)
2 21.90 2,984 3,120 5.27
4 43.80 2,422 2,776 15.48
6 65.70 1,859 2,409 27.72
8 87.60 1,296 1,974 41.71
10 109.50 733 1,409 58.28
Apparent OGIP from the late p/z point: 182 Bscf (true 138)
Effective compressibility 2.01e-05 1/psi
p 4,500 p/z 4,728 corrected 4,728
p 4,000 p/z 4,364 corrected 4,320
p 3,500 p/z 3,945 corrected 3,866
p 3,000 p/z 3,466 corrected 3,362The code produces the pool at a constant 30 MMscf/d for ten years and solves the material balance at each quarter. With the weak aquifer assumed, the p/z values after two years are only about 5 percent above the volumetric line, well within the scatter of real pressure data. After ten years they are nearly double the volumetric values, and a line through the late points extrapolates to about 182 Bscf, a third more than the true gas in place. By then about 58 million barrels of water has entered the pool.
Ethan reruns the Oriskany sandstone pool history with the Fetkovich model, letting the software fit W_ei and J. The best fit has almost no aquifer: the data cannot distinguish a weak aquifer from none over the first four years. That is the honest conclusion, and he writes it that way: the material balance gas in place is an upper bound until either the p/z plot bends or water appears. He recommends running a pulsed-neutron log in the lowest well every two years to watch for the gas-water contact rising, a cheap way to detect influx years before water is produced.
Effect of water drive on recovery
Water drive reduces the ultimate recovery of most gas reservoirs, which surprises engineers trained on oil, where water drive is the best mechanism. Advancing water bypasses and traps gas at a residual gas saturation of 15 to 40 percent of pore volume, and it traps that gas at high pressure, where each pore volume holds many standard volumes. Wells also water out and stop flowing long before the gas zone is depleted, because gas wells have limited ability to lift water. Recovery under a strong water drive may be only 50 to 70 percent, against 80 to 90 percent for volumetric depletion. Producing a water-drive gas pool fast, so that pressure falls before the water arrives, is often the best strategy, together with placing wells high on structure.
Worked problem
Gas left behind by an advancing aquifer
In part of the Oriskany sandstone pool, water has swept a zone with a pore volume of 7.5 million reservoir barrels, trapping gas at a residual saturation of 0.30 at a pressure of 2,030 psia, where B_g = 0.00714 ft³/scf. How much gas is trapped, and how much would be left if the zone had instead been depleted to an abandonment pressure where B_g = 0.0305 ft³/scf with gas saturation 0.76?
Show solution
- Trapped gas: 7.5 × 10⁶ × 5.615 × 0.30 / 0.00714 = 1.77 Bscf.
- Depleted case: 7.5 × 10⁶ × 5.615 × 0.76 / 0.0305 = 1.05 Bscf.
- The water-swept zone leaves about 70 percent more gas behind than depletion would.
Answer: About 1.8 Bscf is trapped behind the water front, against about 1.0 Bscf left after depletion. Trapping at high pressure is why water drive usually lowers gas recovery.
Abnormally pressured gas reservoirs
The Marcellus under the Ten Mile Ridge block is overpressured. Its initial pressure of about 4,500 psia at 7,875 ft corresponds to a gradient of about 0.57 psi/ft, against a normal hydrostatic gradient near 0.44 psi/ft. Overpressure is common in tight gas and shale, where gas generated from organic matter in the rock could not escape fast enough to equilibrate with the surface. It brings several engineering consequences: heavier drilling mud and stronger casing, more gas in place per unit of pore volume and higher initial rates, but also rock that compacts as pressure falls.
In an overpressured reservoir the pore volume compressibility can be much larger than in normally pressured rock, and the middle term of the material balance is no longer negligible. Ignoring it makes the early p/z points fall slowly, just like water influx, and the straight-line extrapolation overstates G, sometimes by 50 percent or more. Classic examples in the Gulf Coast in the 1960s and 1970s led to the corrections now in use. Ramagost and Farshad (1981) wrote the balance with an effective compressibility c_e:
Plotting the corrected p/z against G_p restores the straight line, if c_e is known. When it is not, the corrected line can be found by trying values of c_e until the plot straightens, or c_e can be measured on cores under stress. Some overpressured reservoirs show a distinct two-slope p/z curve, with a shallow early slope while the rock compacts and a steeper later one. The code shows that, for the Marcellus rock compressibility assumed here, the correction is about 3 percent after a 1,000 psi drawdown. That is modest, because the Marcellus is a stiff siltstone, but in soft, highly overpressured sands it can be ten times larger.
For the Ten Mile Ridge wells themselves, the question is mostly academic: average reservoir pressure in the Marcellus is never measured in the classical way, because the rock is too tight for pressure to equalize. The correction matters for the conventional pools and for interpreting the long shut-in pressures that the team does collect in the Marcellus for rate-transient analysis.
Common mistakes
MistakeBooking gas in place from an early straight p/z line in a pool with a large aquifer below it.
InsteadTreat the result as an upper bound until diagnostics such as the Cole plot, observation wells or logs rule out influx.
MistakeAssuming water drive improves gas recovery as it does oil recovery.
InsteadWater traps gas at high pressure and waters out wells; water-drive gas recovery is usually lower than volumetric recovery.
MistakeIgnoring rock compressibility in an overpressured gas reservoir.
InsteadInclude the effective compressibility term, as in the Ramagost-Farshad correction, or the p/z extrapolation will be too high.
MistakeFitting an aquifer model with too little pressure history.
InsteadEarly data rarely constrain aquifer parameters; state the range and collect diagnostic data.
Summary and key terms
- The general gas material balance adds water influx, produced water and water and rock expansion to the volumetric balance.
- Water influx keeps p/z points above the volumetric line; early straight-line fits then overstate G.
- Cole and Havlena-Odeh plots, observation wells and logs detect water drive earlier than the p/z plot alone.
- The Fetkovich aquifer model uses an encroachable water volume and productivity index, fitted to pressure history.
- Water drive usually lowers gas recovery because it traps gas at high pressure and waters out wells.
- In overpressured reservoirs, rock compressibility bends the p/z plot; the Ramagost-Farshad correction restores the line.
- Water influx
- The volume of aquifer water that has entered a reservoir in response to pressure decline.
- Fetkovich aquifer
- A finite aquifer model with pseudo-steady-state flow into the reservoir, defined by encroachable water and a productivity index.
- Cole plot
- A plot of withdrawal divided by unit expansion against production; flat for a volumetric reservoir.
- Residual gas saturation
- The gas saturation trapped behind an advancing water front.
- Overpressure
- Pore pressure above the normal hydrostatic pressure for the depth.
- Effective compressibility
- The combined compressibility of connate water and pore volume per unit of gas pore volume.
Practice problems
Work each problem on paper first, then reveal the answer to check.
What does a Cole plot that rises with time indicate?
Show answer
An energy source other than gas expansion, most often water influx.
Why are early pressures poor at revealing a moderate aquifer?
Show answer
The aquifer responds slowly, so the early deviation from the volumetric line is within the data scatter.
c_w = 3 × 10⁻⁶ /psi, c_f = 15 × 10⁻⁶ /psi, S_wi = 0.25. What is c_e?
Show answer
(3 × 10⁻⁶ × 0.25 + 15 × 10⁻⁶) / 0.75 = 2.1 × 10⁻⁵ per psi.
Name one operating strategy for a water-drive gas pool.
Show answer
Produce at high rates from wells high on structure, to deplete pressure before water arrives.
Lesson quiz · 5 questions
Score 60% or more to complete this lesson.
Create a free account to save your progress, take quizzes and earn a certificate.