
PET-430 · Lesson 5 of 12 · 20 min
Waterflood surveillance
A waterflood is never finished being designed. Reservoirs surprise their engineers, and the flood that looked balanced on the first day develops channels, fractures, dead zones and pressure sinks over the years. Surveillance is the routine collection and analysis of injection and production data that lets an operator see those problems early and correct them. Ethan spends two weeks at the Watford City field office with the field team, going through the injection records for 7-15 and the eleven newer injectors. What he learns there will decide what any EOR project in the Mission Canyon pool must fix first.
What to measure
A surveillance plan sets out what is measured, how often and why. At the injectors, the operator records daily injection volume, wellhead pressure and, where possible, bottomhole pressure, along with periodic injection profiles that show which intervals take the water. At the producers, it records oil, water and gas rates from regular well tests, flowing and static pressures, fluid levels in pumping wells, and water chemistry. Pattern-level tools include pressure surveys, interwell tracers, and in larger projects time-lapse seismic and observation wells. The data are cheap compared with the cost of a poorly performing flood, but they are only useful if someone looks at them regularly with a clear set of diagnostic plots.
The Hall plot
The Hall plot, introduced by H. N. Hall in 1963, is the simplest and most widely used tool for monitoring an injector. It plots the cumulative pressure-time integral against cumulative injection:
where p_wf is the bottomhole injection pressure, p_e the average reservoir pressure in the pattern and W_i the cumulative injected volume. For steady radial flow the injection rate is proportional to the pressure difference, so the plot is a straight line with a slope equal to the reciprocal of the injectivity index. In field units the slope is 141.2 μ_w B_w [ln(r_e / r_w) + s] / (k h). A change of slope signals a change in the well or the near-well rock. An increasing slope means injection is getting harder: plugging from poor water quality, scale or a growing skin. A decreasing slope means injection is getting easier: a fracture opening or extending, a thief zone taking more water, or a casing or cement failure that lets water escape out of zone. A slope that starts steep and flattens during fill-up is normal and reflects the growing water bank.
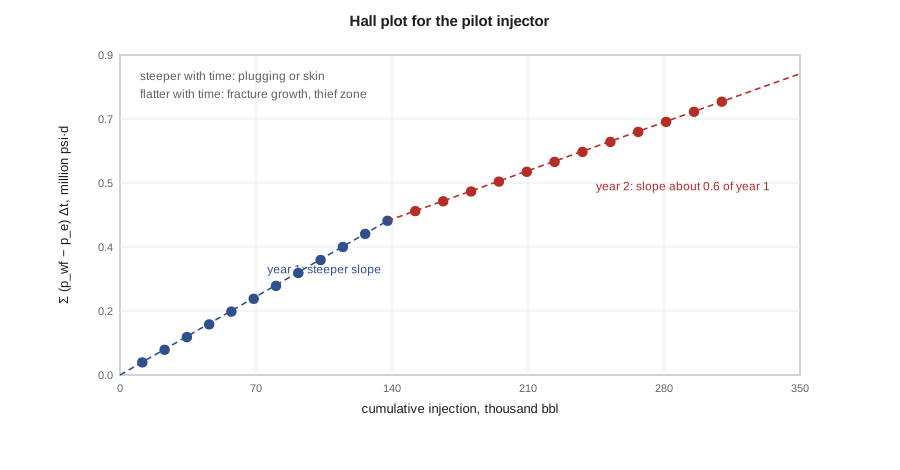
Hall plots are robust because the integration smooths the noisy daily data. They are also forgiving of an imperfect estimate of reservoir pressure, as long as it changes slowly; a derivative version of the plot, analogous to the pressure derivative of well test analysis, sharpens the diagnosis but is noisier. In practice the field engineer keeps a Hall plot for every injector and reviews them monthly.
# Waterflood surveillance: Hall plot slopes, voidage replacement and a WOR extrapolation.
import math
SI = False     # True: metric units, False: oilfield units
P = 1.0 if SI else 0.145038          # kPa -> psi
V = 1.0 if SI else 6.2898            # m3 -> bbl
pu, vu = ('kPa', 'm³') if SI else ('psi', 'bbl')

# 24 months of injection at injector PW: wellhead-corrected bottomhole pressure and monthly volume
p_res = 14000.0                                  # average pattern pressure, kPa
months = list(range(1, 25))
rate = [60.0] * 12 + [75.0] * 12                 # m3/d
pbh = [p_res + 8000 + 30 * m for m in months[:12]] + [p_res + 6200 + 20 * (m - 12) for m in months[12:]]
hall, cum = [], []
H = W = 0.0
for q, p in zip(rate, pbh):
    W += q * 30.4; H += (p - p_res) * 30.4
    cum.append(W); hall.append(H)
def slope(i, j): return (hall[j] - hall[i]) / (cum[j] - cum[i])
s1, s2 = slope(0, 11), slope(12, 23)
print(f"Hall slope, months 1-12:  {s1 * P / V:7.2f} {pu}·d per {vu}")
print(f"Hall slope, months 13-24: {s2 * P / V:7.2f} {pu}·d per {vu}  ({s2 / s1:.2f} of the first)")
print("A falling slope means easier injection: possible fracture growth or a thief zone.")

# Voidage replacement ratio for the pattern (reservoir volumes)
Bo, Bw, Bg, Rs = 1.29, 1.01, 0.0075, 100.0       # rm3/m3, rm3/m3, rm3/sm3, sm3/m3
oil, water, gas, inj = 38.0, 140.0, 4800.0, 230.0  # m3/d, m3/d, sm3/d, m3/d
free_gas = max(gas - Rs * oil, 0.0)
void = oil * Bo + water * Bw + free_gas * Bg
vrr = inj * Bw / void
print(f"Voidage {void * V:.0f} reservoir {vu}/d, injection {inj * Bw * V:.0f} reservoir {vu}/d, VRR = {vrr:.2f}")

# WOR extrapolation: log10(WOR) linear in cumulative oil
np_ = [100e3, 150e3, 200e3, 250e3, 300e3]        # m3
wor = [2.0, 3.4, 5.6, 9.5, 15.8]
n = len(np_); xm = sum(np_) / n; ym = sum(math.log10(w) for w in wor) / n
b = sum((x - xm) * (math.log10(w) - ym) for x, w in zip(np_, wor)) / sum((x - xm) ** 2 for x in np_)
a = ym - b * xm
np_lim = (math.log10(49.0) - a) / b               # economic limit WOR = 49 (98 % water cut)
print(f"Cumulative oil at WOR 49: {np_lim * V / 1e3:,.0f} thousand {vu} ({(np_lim - np_[-1]) * V / 1e3:,.0f} thousand to go)")Hall slope, months 1-12: 3.16 psi·d per bbl Hall slope, months 13-24: 1.95 psi·d per bbl (0.62 of the first) A falling slope means easier injection: possible fracture growth or a thief zone. Voidage 1245 reservoir bbl/d, injection 1461 reservoir bbl/d, VRR = 1.17 Cumulative oil at WOR 49: 2,575 thousand bbl (688 thousand to go)
Voidage replacement and pressure
The voidage replacement ratio (VRR) compares the reservoir volume of fluid injected with the reservoir volume of fluid produced, over a period or cumulatively:
A VRR of one maintains average pressure; above one the pressure rises, and below one it falls. Early in a flood, operators often run a VRR above one to repressure the reservoir above the bubble point and to fill up the free gas space. Later they hold it near one, pattern by pattern. A field VRR of one can hide large imbalances: a pattern with a VRR of 1.5 next to one at 0.6 means water is moving across pattern boundaries and oil is being pushed into areas where no producer can capture it. Pattern balancing, adjusting injection rates so that each pattern's VRR and pressure stay close to their targets, is one of the most effective ways to improve a mature flood.
The code shows a pattern where injection runs ahead of withdrawal, with a VRR of about 1.2. Combined with the falling Hall slope at the injector, this suggests that some of the water is leaving the pattern or bypassing the oil through a high-permeability path. Ethan checks the producers: one offset producer, two locations to the north, has seen its water cut rise faster than the others, and its water chemistry matches the injection water. The evidence points to a channel.
Water-oil ratio diagnostics
The water-oil ratio of a producer or a pattern, plotted on a logarithmic scale against cumulative oil, is often close to a straight line in the late life of a waterflood. Extrapolating the line to the economic limit gives an estimate of the remaining recoverable oil that is independent of the simulation model, and a valuable check on it. A water-oil ratio of 49, a water cut of 98 percent, is a common economic limit for a light oil flood with low lifting costs; the actual limit depends on oil price and water handling cost.
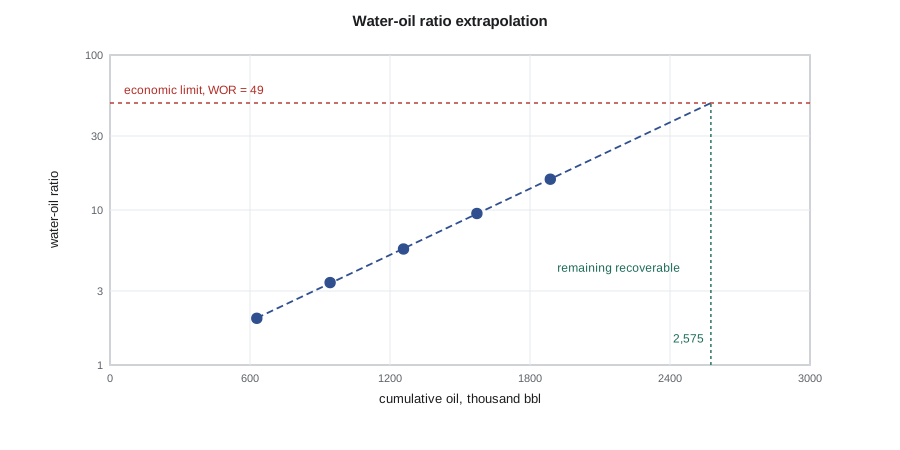
Chan's diagnostic plots of 1995 go further. They plot the water-oil ratio and its time derivative on log-log scales against time. A coning problem gives a ratio that rises gradually with a falling derivative, while channeling through a high-permeability layer gives a rapid rise with a positive derivative. Near-wellbore problems such as casing leaks or channels behind pipe show an abrupt jump. The diagnosis is not definitive, but it helps the engineer decide which wells to investigate with production logs or tracers.
Conformance
Conformance is the uniformity of the flood front, vertically and areally. Poor conformance shows up as early breakthrough at some producers, injection profiles in which one interval takes most of the water, and Hall plots or pressure falloff tests that indicate fractures. The tools to fix it depend on where the problem lies. Near the wellbore, mechanical isolation with packers or cement, or selective perforation, can shut off a thief interval if it is separated from the rest of the section by an impermeable barrier. Deeper in the reservoir, where crossflow would let water bypass a near-well plug, gels are used: polymer solutions cross-linked with chromium or aluminum compounds that set in place and divert water into the unswept layers. Newer products include microgels and temperature-activated particles that expand deep in the reservoir. These treatments are sometimes counted as EOR, and they are often the cheapest incremental barrels a mature flood can find.
Interwell tracers are the direct test of a channel. A small amount of a chemical or radioactive tracer that travels with the water, such as a fluorinated benzoic acid or tritium, is injected and the producers are sampled. The arrival time, the peak concentration and the fraction recovered show which producers each injector supports and how much pore volume the water sees. A tracer that arrives at an offset producer within weeks, with a sharp peak, confirms a fracture or a thin, highly permeable streak.
Worked problem
Voidage replacement in a pattern
A pattern produces 239 STB/d of oil, 881 bbl/d of water and 169 Mscf/d of gas. The oil has B_o = 1.29, R_s = 561 scf/STB, and the free gas has B_g = 0.0013 rb/scf; B_w = 1.01. The injector takes 1,447 bbl/d. Find the VRR.
Show solution
- Free gas produced is 169,000 − 561 × 239 = 34,900 scf/d.
- Reservoir voidage is 239 × 1.29 + 881 × 1.01 + 34,900 × 0.0013 = 308 + 890 + 45 = 1,245 rb/d.
- Injection at reservoir conditions is 1,447 × 1.01 = 1,461 rb/d.
- VRR = 1,461 / 1,245 = 1.17.
Answer: The VRR is about 1.2, so the pattern is over-injected. Unless pressure is being deliberately raised, either the injection should be cut or the water is leaving the pattern.
Acting on the evidence
Surveillance pays off only when it leads to action. The field team at Watford City uses a monthly review that ranks patterns by a few indicators: VRR, pressure, Hall slope change, water cut trend and oil rate against forecast. Problem patterns get a short list of candidate actions, such as a rate change, a profile log, a tracer test, a gel treatment, a workover or a conversion, each with a rough cost and expected benefit. For the pilot pattern, Ethan recommends a tracer test from 7-15, an injection profile, and a cut in rate until the results are in. The tracer, run over the following three months, arrives at the northern offset producer in 23 days, confirming that a high-permeability streak in the thief layer connects them.
That result matters for EOR as much as for the waterflood. Any injectant, whether gas, polymer or surfactant, will follow the same streak. A tertiary project in the Mission Canyon pool will need conformance control first, or a process that provides it, such as polymer or WAG.
Modern surveillance also uses data-driven models alongside the classical plots. The capacitance-resistance model, for example, fits each producer's total rate as a weighted, time-lagged sum of the injection rates of the surrounding injectors, and the fitted weights show which injectors support which producers, much as a tracer would but without any field operation.
Common mistakes
MistakeReading a falling Hall slope as good news.
InsteadEasier injection may mean fracture growth or a thief zone; check where the water goes before raising rates.
MistakeManaging VRR only at field level.
InsteadBalance each pattern; a field VRR of one can hide large cross-pattern flows.
MistakeExtrapolating WOR trends from early-life data.
InsteadThe log-linear trend appears only after the flood matures; early data curve strongly.
MistakePlacing a near-well gel where layers communicate.
InsteadCrossflow lets water bypass a near-well plug; use deep-placed gels or treat only isolated layers.
Summary and key terms
- Surveillance collects injection, production, pressure and profile data and reviews them with standard diagnostic plots.
- The Hall plot of cumulative pressure-time integral against cumulative injection has a slope inversely proportional to injectivity.
- An increasing Hall slope indicates plugging or skin; a decreasing slope indicates fracturing, a thief zone or out-of-zone injection.
- The voidage replacement ratio compares injected and produced reservoir volumes and should be managed pattern by pattern.
- Log water-oil ratio against cumulative oil is often linear late in a flood and can be extrapolated to the economic limit.
- Conformance problems are diagnosed with profiles, Chan plots and tracers and treated mechanically or with gels.
- Hall plot
- A plot of the cumulative pressure difference-time product against cumulative injection for an injector.
- Voidage replacement ratio
- The ratio of reservoir volumes injected to reservoir volumes produced.
- Pattern balancing
- Adjusting injection rates so that each pattern's voidage and pressure stay on target.
- Conformance
- The uniformity of the flood front through the reservoir volume.
- Thief zone
- A high-permeability interval or streak that takes a disproportionate share of the injected fluid.
- Interwell tracer
- A chemical or radioactive marker injected with the water to trace flow paths to producers.
- Economic limit
- The production rate or water-oil ratio at which operating costs equal revenue.
Practice problems
Work each problem on paper first, then reveal the answer to check.
The Hall slope of an injector doubles over six months. What might be happening?
Show answer
Plugging of the sandface by solids or scale, or a growing skin; check water quality.
A pattern has VRR = 0.7 for two years. What happens to its pressure?
Show answer
It falls, possibly below the bubble point, releasing gas and reducing oil mobility.
What water cut corresponds to a WOR of 19?
Show answer
19 / (1 + 19) = 95 percent.
What does a tracer arriving in days with a sharp peak indicate?
Show answer
A fracture or thin, highly permeable channel between the injector and producer.
Lesson quiz · 5 questions
Score 60% or more to complete this lesson.
Create a free account to save your progress, take quizzes and earn a certificate.