
PET-350 · Lesson 7 of 12 · 19 min
Archie's equation and water saturation
With porosity, Rt and Rw in hand, Ethan is ready for the calculation that everyone in the asset team is waiting for. 'Water saturation,' Imogen says, 'is where the money is. Every barrel in Lena's volumetrics is pore volume times one minus water saturation. And the equation we use for clean rocks has barely changed since 1942.'
This lesson develops Archie's equation, which relates the resistivity of a clean rock to its porosity, water saturation and formation water resistivity. It explains the formation factor, the cementation and saturation exponents and where their values come from, and then shows two graphical methods, the Pickett plot and the Hingle plot, that find Rw and the exponents directly from logs.
The formation factor
In 1942, G. E. Archie of Shell published measurements on core samples from several oil fields. He found that when a clean rock is fully saturated with brine, its resistivity R0 is proportional to the resistivity of the brine Rw. The constant of proportionality, which he called the formation resistivity factor F, depends only on the pore structure, not on the brine.
The formation factor rises as porosity falls, because there are fewer and narrower paths for current. The exponent m is the cementation exponent. Archie found values near 2 for consolidated sandstones; less cemented rocks have smaller values and well-cemented or vuggy rocks larger values. The constant a, often called the tortuosity factor, was not in Archie's original form; it was added later to fit some datasets better. Common choices are a = 1 with m = 2 for consolidated rocks, and the Humble form a = 0.62 with m = 2.15 for some unconsolidated sandstones. The best practice is to measure a and m on core samples from the reservoir.
Water saturation
Archie's second finding was that when part of the pore space is filled with oil, the resistivity rises above R0 according to a power of the water saturation.
The exponent n is the saturation exponent. It is usually close to 2 in water-wet rocks, and higher, sometimes 3 to 5 or more, in oil-wet rocks where the water forms isolated films and droplets rather than continuous paths. Because n appears as an exponent, uncertainty in it has a large effect on saturation in low-saturation rocks. Like m, it is best measured on core, in special core analysis covered in lesson 11.
Archie's equation applies to clean rocks, where only the pore water conducts. In shaly rocks, clay conductivity adds to the measured conductivity and the equation overestimates water saturation. Lesson 8 covers the modifications. Archie's equation also assumes a uniform pore system; carbonates with vugs and fractures need special treatment, which lesson 9 covers.
# Archie water saturation, and a Pickett-plot fit of m and Rw from water-bearing points
import math
a, m, n = 1.0, 2.0, 2.0
rw = 0.045                             # ohm·m at formation temperature
for phi, rt in ((0.14, 20.4), (0.12, 11.0), (0.10, 4.5)):
    sw = (a * rw / (phi ** m * rt)) ** (1 / n)
    print(f"porosity {phi:.2f}, Rt {rt:5.1f} ohm·m -> Sw = {sw:.2f}")
# Pickett: log Rt = log(a Rw) - m log(phi) for Sw = 1; fit a straight line to water-zone points
water = [(0.08, 7.8), (0.10, 4.9), (0.12, 3.5), (0.14, 2.5), (0.16, 1.9)]
xs = [math.log10(p) for p, _ in water]; ys = [math.log10(r) for _, r in water]
xb, yb = sum(xs) / len(xs), sum(ys) / len(ys)
slope = sum((x - xb) * (y - yb) for x, y in zip(xs, ys)) / sum((x - xb) ** 2 for x in xs)
icept = yb - slope * xb
print(f"Pickett fit: m = {-slope:.2f}, a·Rw = {10 ** icept:.3f} ohm·m (intercept at porosity 1)")porosity 0.14, Rt 20.4 ohm·m -> Sw = 0.34 porosity 0.12, Rt 11.0 ohm·m -> Sw = 0.53 porosity 0.10, Rt 4.5 ohm·m -> Sw = 1.00 Pickett fit: m = 2.03, a·Rw = 0.046 ohm·m (intercept at porosity 1)
For the Tamarack 8-27 pilot well, the program uses a = 1, m = 2, n = 2 and Rw = 0.045 ohm·m, the teaching values adopted in lesson 3. An interval with 14 percent porosity and Rt of 20.4 ohm·m gives a water saturation of 34 percent; 12 percent porosity with Rt of 11 ohm·m gives 53 percent; and 10 percent porosity at 4.5 ohm·m gives 100 percent, a water-bearing interval.
These results show how sensitive saturation is to its inputs. If Rt were taken from the uncorrected deep curve, 20.4 ohm·m, instead of the corrected 25.8 ohm·m from lesson 4, saturation in the top interval would be 34 percent rather than about 30 percent. A 10 percent error in Rw or a change in m from 2.0 to 2.2 has a similar effect. Saturation is therefore always reported with its inputs, so that others can see and test them.
The Pickett plot
Taking logarithms of Archie's equation gives a straight-line relation between log Rt and log porosity for any fixed water saturation.
On a log-log plot of Rt against porosity, every point with Sw = 1 falls on a line with slope −m and an intercept at porosity 1 equal to aRw. Lines for lower saturations are parallel and shifted upward. A Pickett plot therefore lets the interpreter find m and Rw from a water-bearing interval without knowing either in advance: fit a line through the lowest, water-bearing points, read its slope and intercept, then read saturations for other points from their distance above the line.
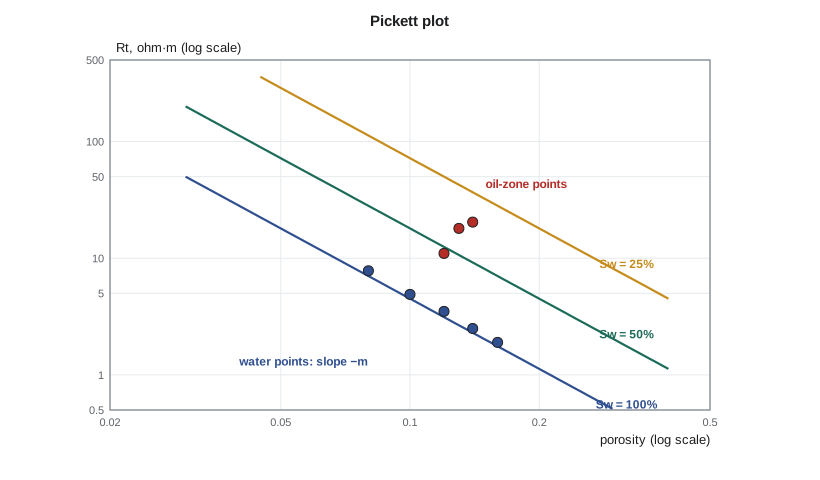
The program fits a line through five water-zone points and finds m = 2.03 and aRw = 0.046 ohm·m, close to the values assumed. When a Pickett plot gives an m very different from 2 or an Rw very different from the water analysis, it is a signal to check the porosity, the resistivity correction or the assumption that the points are truly wet and clean.
The Pickett plot works well when the interval contains a clean water-bearing zone with a range of porosities, and when Rw is constant with depth. It is less reliable when the rock is shaly, when the porosity range is narrow, or when the formation water salinity changes. In tight rocks such as the middle Bakken, finding a reliable wet interval can be difficult, and the plot is then used more as a consistency check.
The Hingle plot
The Hingle plot rearranges Archie's equation so that porosity is a linear function of Rt raised to the power −1/m. On special graph paper with a scaled resistivity axis, water-bearing points line up on a straight line through zero porosity at infinite resistivity, and the line's slope gives Rw. A Hingle plot needs m to be chosen in advance, while a Pickett plot finds it, so the Pickett plot is more common today. The Hingle plot is still useful for finding the matrix value of a porosity tool, because it can be plotted directly with bulk density or transit time instead of computed porosity.
Bulk volume water
The product of porosity and water saturation, bulk volume water or BVW, is the fraction of the rock volume occupied by water. In a zone at irreducible water saturation, where only capillary-bound water remains and the rock will produce water-free hydrocarbons, BVW tends to be roughly constant, because finer-grained rocks have both lower porosity and higher irreducible saturation. Plotting porosity against saturation and finding points along a hyperbola of constant BVW suggests a zone at irreducible saturation. Points scattered well above it suggest movable water and a risk of water production.
In the Tamarack 8-27 pilot well, the upper part of the middle Bakken shows BVW close to 0.035 across its porosity range, which Imogen reads as close to irreducible saturation for this fine-grained rock. Below it, BVW rises toward 0.06, suggesting more movable water near the base of the member. That interpretation will be tested against capillary pressure from core in lesson 11.
Uncertainty in water saturation
Each input to Archie's equation carries uncertainty: porosity from the matrix choice and tool error, Rt from invasion and bed effects, Rw from the method used, and a, m and n from core measurements or assumptions. Because the equation is a product of powers, the relative errors combine. A simple way to see the effect is to change each input by a reasonable amount and recompute saturation. Petrophysicists often present saturation as a range or as low, base and high cases, which feed into the reserves categories that reservoir engineers report.
Worked problem
Archie saturation
A clean sandstone has porosity 0.16 and true resistivity 18 ohm·m. Rw at formation temperature is 0.06 ohm·m. Use a = 1, m = 2 and n = 2. Find Sw and BVW.
Show solution
- Formation factor F = 1/0.16² = 1/0.0256 = 39.1.
- R0 = F × Rw = 39.1 × 0.06 = 2.34 ohm·m.
- Sw = (R0/Rt)^(1/2) = (2.34/18)^0.5 = 0.130^0.5 = 0.36.
- BVW = 0.16 × 0.36 = 0.058.
Answer: Water saturation is about 36 percent and bulk volume water about 0.058.
Where Archie's exponents come from
Archie's work was empirical: he fitted lines to laboratory measurements on cores from a few fields, mainly in the Gulf Coast. That the same simple form works in so many rocks is a reflection of a physical idea. The pore space is a network of connected channels, and the current has to follow the channels, which are narrower and more winding than the bulk rock. The cementation exponent measures how quickly the network's conductance falls as porosity falls; more cementation means narrower throats, more tortuous paths and a larger m. The saturation exponent measures how quickly the water network loses conductance as oil displaces water. In water-wet rock, water stays continuous along grain surfaces, so conductance falls smoothly and n stays near 2. In oil-wet rock, water is pushed into disconnected pockets and conductance collapses faster, so n rises.
Because the exponents depend on pore geometry and wettability, they can change within a single reservoir. A clean, well-sorted sand and a cemented, poorly sorted sand in the same formation can have m values that differ by 0.2 or more. Laboratory measurements on plugs from each rock type, grouped as lesson 11 describes, are therefore more useful than a single field-wide value.
Low-resistivity pay
Some productive zones read so low on resistivity that Archie's equation calls them wet. The usual causes are fine grain size, which raises irreducible water saturation while the rock still produces dry oil; conductive minerals such as pyrite; clay conductivity in shaly sands (lesson 8); thin laminations of sand and shale below tool resolution (lesson 4); and very salty formation water. Such zones are called low-resistivity pay, and they were overlooked in many older wells. Recognizing them depends on combining resistivity with other evidence: mud log shows, NMR bound fluid, bulk volume water, capillary pressure saturations and formation test samples. Several fields have been found or extended by re-examining old logs with this in mind.
A note on the 1942 paper
Archie's paper, published in the Transactions of the American Institute of Mining and Metallurgical Engineers, is short and practical. It gave the industry a way to turn resistivity logs, which had been run since the late 1920s mainly for correlation, into estimates of oil saturation. It is still the starting point of almost every saturation calculation, and the many shaly-sand and carbonate models that followed are written as modifications of it.
Saturation with depth
Plotting water saturation against depth through a reservoir with a single oil-water contact usually shows a characteristic shape: a nearly constant low saturation high above the contact, a transition zone where saturation rises gradually, and 100 percent water below the free water level. The thickness of the transition depends on pore size, as lesson 11 explains. If the log saturations show a sudden jump instead, or saturations that rise and fall erratically, the cause may be a change in rock type, an error in Rt in thin beds, or a varying Rw. Looking at the saturation profile as a whole, rather than one sample at a time, is one of the quickest checks on an interpretation.
Common mistakes
MistakeUsing Archie's equation in shaly sands without modification.
InsteadUse a shaly-sand model where clay conductivity is significant.
MistakeAssuming m and n are always 2.
InsteadMeasure them on core, or test them with Pickett plots; carbonates and oil-wet rocks differ.
MistakeUsing an Rw at surface temperature.
InsteadRw must be at formation temperature, like Rt.
MistakeFitting a Pickett line through points that are not water-bearing.
InsteadUse only the lowest, clean, water-bearing points, ideally confirmed by tests.
MistakeReporting saturation without stating the inputs.
InsteadReport a, m, n, Rw and the porosity and Rt sources so the result can be checked.
Summary and key terms
- The formation factor F = R0/Rw = a/φ^m depends on the pore structure.
- Archie's equation gives Sw from porosity, Rt and Rw with exponents m and n.
- m is near 2 for consolidated sandstones; n is near 2 in water-wet rocks and higher in oil-wet rocks.
- A Pickett plot finds m and Rw from water-bearing points on a log-log plot of Rt against porosity.
- Bulk volume water near a constant value suggests a zone at irreducible water saturation.
- Saturation uncertainty combines errors in all inputs and should be reported as a range.
- Formation factor
- The ratio of the resistivity of a brine-saturated rock to the brine resistivity.
- Cementation exponent (m)
- The exponent of porosity in the formation factor.
- Saturation exponent (n)
- The exponent of water saturation in Archie's equation.
- Pickett plot
- A log-log plot of Rt against porosity used to find m, Rw and saturation.
- Bulk volume water
- The product of porosity and water saturation.
- Irreducible water saturation
- The water saturation below which water will not flow.
Practice problems
Work each problem on paper first, then reveal the answer to check.
What happens to F when porosity falls?
Show answer
It rises.
Why is n higher in oil-wet rocks?
Show answer
Water forms disconnected films and droplets rather than continuous paths.
What does the intercept of the water line on a Pickett plot give?
Show answer
a times Rw, at porosity 1.
What does a nearly constant BVW suggest?
Show answer
A zone at irreducible water saturation.
Lesson quiz · 5 questions
Score 60% or more to complete this lesson.
Create a free account to save your progress, take quizzes and earn a certificate.