
PET-350 · Lesson 4 of 12 · 19 min
Resistivity logs
The resistivity track of the Tamarack 8-27 pilot well print shows three curves that separate across the Bakken and come together in the shale above. Ethan asks which one to use. 'None of them, exactly,' Imogen says. 'The shallow curve reads mostly the flushed zone and the deep curve reads mostly the uninvaded rock, but even the deep curve is pulled toward the flushed zone when invasion is deep. The number you need, Rt, is something you estimate from all three.'
Resistivity is the key measurement for water saturation, because rock grains and hydrocarbons are electrical insulators and only the water in the pores conducts. This lesson explains why rocks conduct, how laterolog and induction tools measure resistivity, what depth of investigation and vertical resolution mean, how array tools give several depths of reading, and how invasion corrections recover the true resistivity.
Why rocks conduct
Dry quartz, calcite and dolomite do not conduct electricity, and neither do oil and gas. Formation water does, because it carries dissolved salts whose ions move in an electric field. The resistivity of a reservoir rock therefore depends on how much water it contains, how salty that water is, and how the pores connect. A rock with lots of salty water in well-connected pores has low resistivity. The same rock filled mostly with oil has high resistivity. This contrast is the basis of saturation evaluation, and Archie's equation in lesson 7 turns it into a number.
Clay minerals add a second path for current. Their surfaces carry a layer of exchangeable ions that conducts even when the pore water is fresh. This excess conductivity makes shaly sands read lower resistivities than clean sands with the same saturation, and if it is ignored, the water saturation is overestimated. Lesson 8 deals with it.
Resistivity is measured in ohm-meters. Typical values range from a fraction of an ohm-meter in shale and salty water sand to tens or hundreds of ohm-meters in tight or oil-bearing rock, and thousands in salt or anhydrite. The range is so wide that logs plot it on logarithmic scales.
Laterolog tools
A laterolog sends a measured current from electrodes on the tool into the formation and measures the voltage needed to drive it. Extra guard electrodes carry currents that focus the measuring current into a thin sheet perpendicular to the borehole, so that it flows sideways through the formation rather than up and down the conductive mud. The focusing lets laterologs work well in salty mud and in resistive formations, and it gives good vertical resolution. Because current must flow through the mud, laterologs need water-based mud.
Modern array laterolog tools use several electrode arrangements to record five or six curves with different depths of investigation at once. The shallowest curves read mostly the flushed zone and the deepest read well into the uninvaded rock. Micro-resistivity pad tools, pressed against the borehole wall, read only a few centimeters into the rock and give an estimate of Rxo.
Induction tools
An induction tool does not need electrical contact with the formation. A transmitter coil carrying an alternating current sets up an alternating magnetic field, which induces circulating eddy currents in the formation around the borehole. These currents set up their own magnetic field, which induces a voltage in a receiver coil. The receiver signal is proportional to the formation's conductivity, the inverse of resistivity. Because no current passes through the mud directly, induction tools work in oil-based mud, freshwater mud and air-filled holes.
Induction tools are most accurate in low to moderate resistivities, where conductivity is large enough to give a strong signal, and they lose accuracy in very resistive formations. They are affected by conductive borehole fluid in large holes, which processing corrects. Array induction tools use one transmitter and several receivers at different spacings, and processing combines the signals into curves with set depths of investigation, typically labeled 10, 20, 30, 60 and 90 inches, and matched vertical resolutions.
| Feature | Laterolog | Induction |
|---|---|---|
| Physical principle | Measures voltage for a focused injected current | Measures signal from currents induced by a coil |
| Mud | Water-based (conductive) only | Any mud, best in fresh or oil-based |
| Best range | Moderate to high resistivity, salty mud | Low to moderate resistivity, fresh mud |
| Responds to | Resistivity (beds in series) | Conductivity (beds in parallel) |
| Typical use | Carbonates, salty mud, resistive rocks | Sandstones, oil-based mud, fresh mud |
A useful rule of thumb is that laterologs are preferred when the mud is salty, the formation is resistive, or Rmf is much smaller than Rw, while induction tools are preferred in fresh or oil-based mud and in low-resistivity formations. In practice the mud system often decides: an oil-based mud well gets induction logs. For the Tamarack 8-27 pilot well, drilled with fresh water-based mud through moderately resistive sandstone, Imogen chose an array induction tool with a micro-resistivity pad for Rxo.
Depth of investigation and vertical resolution
Every resistivity reading is an average over a volume of rock. The depth of investigation describes how far into the formation that volume extends; it is usually defined as the diameter within which half the signal originates. The vertical resolution describes the thinnest bed whose resistivity the tool can read correctly. Deep-reading tools see beyond invasion but average over thicker intervals; shallow tools resolve thin beds but see mostly flushed rock.
In thin beds, a deep resistivity tool reads a value between the bed's resistivity and that of the shoulder beds above and below. For a thin oil-bearing sand between conductive shales, the deep tool reads too low, and saturation from it is too high. Shoulder-bed corrections and high-resolution processing reduce the effect, but beds thinner than about half a meter or a couple of feet remain hard to evaluate with conventional resistivity. Laminated sand-shale sequences, where each layer is thinner than the tool can resolve, need special techniques such as tri-axial induction, which measures resistivity both along and across the bedding.
Reading invasion from curve separation
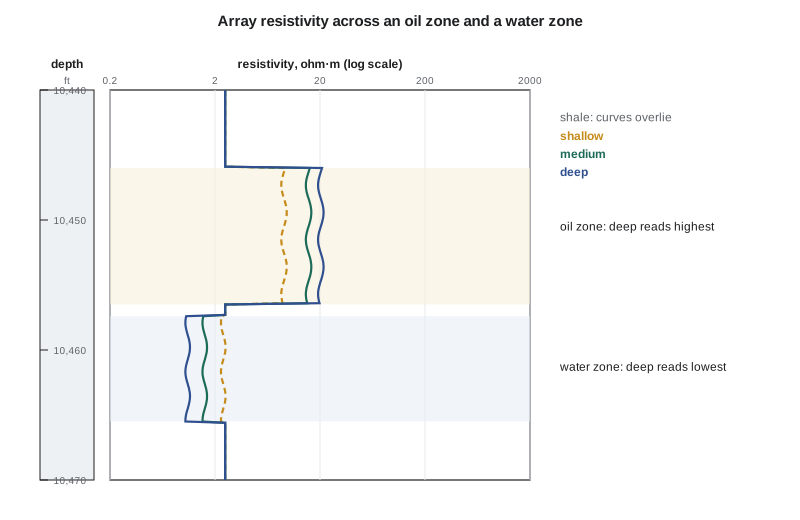
When fresh filtrate invades an oil-bearing zone with salty connate water, the flushed zone contains fresh filtrate plus residual oil and reads moderately resistive, while the uninvaded zone contains salty water plus much more oil and reads more resistive still. The curves then read shallow < medium < deep. In a water-bearing zone with salty water, the flushed zone of fresh filtrate is more resistive than the salty uninvaded zone, so the deep curve reads lowest. This reversal from one zone to the other is a classic indication of the oil-water transition on a resistivity log.
With salty mud or when Rmf is close to Rw, separation is small even in permeable rock, and invasion is harder to see. In oil-based mud, the flushed zone holds oil filtrate and appears resistive in both oil and water zones. Interpretation must always start from the mud type and the Rmf to Rw ratio.
Estimating Rt from several depths of reading
When three or more curves with different depths of investigation are available, they can be inverted to estimate Rt, Rxo and the invasion diameter. The simplest model assumes a step profile: the flushed zone has resistivity Rxo out to a diameter di, and the formation beyond has resistivity Rt. Each tool reading is then a weighted average of the two, with the weight set by the tool's geometric factor, the fraction of its signal coming from inside di. Service companies publish tornado charts, named for their funnel shape, that solve this problem graphically from ratios of the curves. Modern processing does the same inversion numerically, often with more realistic profiles.
# Step-profile invasion: solve for Rt, Rxo and invasion diameter from shallow, medium and deep readings
import math
SI = False
du = "mm" if SI else "in"
def J(d, k):                   # a simple pseudo-geometric factor: fraction of signal from inside diameter d
    return 1 - math.exp(-d / k)
k_sh, k_md, k_dp = (150.0, 400.0, 900.0) if SI else (6.0, 16.0, 36.0)
def model(rt, rxo, di):
    return [J(di, k) * rxo + (1 - J(di, k)) * rt for k in (k_sh, k_md, k_dp)]
meas = [9.1, 15.6, 20.4]       # ohm·m: shallow, medium, deep (an oil zone invaded by fresher filtrate)
best = None
for rt10 in range(100, 400):
    rt = rt10 / 10
    for rxo10 in range(30, 120):
        rxo = rxo10 / 10
        for di in (range(150, 1500, 25) if SI else range(6, 60)):
            m = model(rt, rxo, di)
            err = sum((math.log(a) - math.log(b)) ** 2 for a, b in zip(m, meas))
            if best is None or err < best[0]: best = (err, rt, rxo, di)
err, rt, rxo, di = best
print(f"measured: shallow {meas[0]} medium {meas[1]} deep {meas[2]} ohm·m")
print(f"best fit: Rt = {rt:.1f} ohm·m, Rxo = {rxo:.1f} ohm·m, invasion diameter = {di} {du}")
print(f"deep reading / Rt = {meas[2] / rt:.2f}: the deep curve still reads {100 * (1 - meas[2] / rt):.0f}% low")measured: shallow 9.1 medium 15.6 deep 20.4 ohm·m best fit: Rt = 25.8 ohm·m, Rxo = 6.5 ohm·m, invasion diameter = 12 in deep reading / Rt = 0.79: the deep curve still reads 21% low
For the oil zone near the top of the middle Bakken in the Tamarack 8-27 pilot well, the three readings are 9.1, 15.6 and 20.4 ohm·m. The inversion gives Rt of about 25.8 ohm·m, Rxo of about 6.5 ohm·m and an invasion diameter of about 12 in. The deep curve still reads about 21 percent below Rt. Using the deep reading directly as Rt would overstate water saturation by roughly 10 percent of its value, which is enough to move a marginal interval across a pay cutoff.
The geometric factors in the program are simplified for teaching. Real tools have response functions that depend on the hole size, the mud resistivity and the contrast between zones, and the inversion is only as good as the profile model. When invasion is very deep, no combination of readings can recover Rt reliably, and LWD resistivity recorded soon after drilling, before invasion deepened, may be a better source.
Rxo and the movable hydrocarbon check
The flushed-zone resistivity is useful in its own right. Archie's equation applied to the flushed zone, with Rmf in place of Rw, gives the flushed-zone water saturation Sxo. Comparing Sxo with the uninvaded-zone saturation Sw shows how much hydrocarbon the filtrate displaced. If Sxo is much larger than Sw, the hydrocarbon is movable; if the two are similar, the hydrocarbon may be immovable or the rock may be too tight to have been flushed. This movable hydrocarbon check is a standard part of an interpretation and is revisited in lesson 12.
LWD resistivity
LWD resistivity tools usually measure the phase shift and amplitude ratio of electromagnetic waves between transmitters and receivers in the drill collar, giving several depths of investigation from different spacings and frequencies. Because they record soon after drilling, invasion is shallow, and the deep readings are often close to Rt. In horizontal wells, the phase and attenuation curves separate when the tool approaches a bed boundary, and newer azimuthal and deep directional tools can map boundaries several meters or many feet from the well. These are the measurements that geosteering in the Tamarack Lake field horizontals relied on.
Worked problem
Choosing Rt
An array induction log in a sand reads 6, 10 and 12 ohm·m on its shallow, medium and deep curves. The mud filtrate is fresh and the formation water is salty. Is the sand likely oil-bearing or water-bearing, and is the deep reading a good estimate of Rt?
Show solution
- The curves increase with depth of investigation: shallow < medium < deep.
- With fresh filtrate and salty water, a water zone would show the deep curve lowest, so this pattern suggests hydrocarbon.
- The medium and deep readings still differ by 20 percent, so the deep curve is probably still affected by invasion.
- Rt is likely somewhat higher than 12 ohm·m; an inversion would give the value.
Answer: The sand is probably oil-bearing, and Rt is somewhat above the deep reading of 12 ohm·m.
Common mistakes
MistakeUsing the deep resistivity curve as Rt without checking invasion.
InsteadCompare the curves; correct for invasion where they still separate.
MistakeRunning laterologs in oil-based mud.
InsteadUse induction tools in nonconductive mud.
MistakeEvaluating thin beds from deep resistivity alone.
InsteadAccount for shoulder-bed effects; use high-resolution or tri-axial measurements in laminated rock.
MistakeReading curve separation without knowing Rmf and Rw.
InsteadThe direction of separation depends on the filtrate-water contrast and the hydrocarbon.
MistakeIgnoring clay conductivity in shaly sands.
InsteadUse a shaly-sand model; Archie alone overestimates water saturation there.
Summary and key terms
- Only pore water conducts current, so resistivity reflects water volume and salinity.
- Laterologs inject focused current and suit salty mud and resistive rock; induction tools suit fresh and oil-based mud.
- Array tools record several depths of investigation; deep curves see past invasion, shallow curves resolve thin beds.
- Curve separation indicates invasion and permeability; its direction depends on the filtrate-water contrast.
- Step-profile inversion of several curves estimates Rt, Rxo and invasion diameter.
- Comparing flushed-zone and uninvaded-zone saturations shows whether hydrocarbons are movable.
- Resistivity
- The property of a material that resists electric current, measured in ohm-meters.
- Laterolog
- A resistivity tool that injects focused current into the formation.
- Induction tool
- A resistivity tool that induces currents in the formation with coils.
- Depth of investigation
- The distance into the formation from which most of a tool's signal comes.
- Tornado chart
- A chart for estimating Rt, Rxo and invasion diameter from curves with different depths.
- Shoulder bed effect
- The influence of adjacent beds on a tool reading in a thin bed.
Practice problems
Work each problem on paper first, then reveal the answer to check.
Why do induction tools work in oil-based mud?
Show answer
They induce currents with coils and need no electrical contact through the mud.
What does it mean when shallow, medium and deep curves overlie?
Show answer
Little or no invasion, or Rmf close to Rw, or an impermeable rock.
Why might a thin oil sand between shales read too low on deep resistivity?
Show answer
The tool averages in the conductive shoulder beds.
What does Sxo much greater than Sw indicate?
Show answer
Movable hydrocarbon displaced by filtrate.
Lesson quiz · 5 questions
Score 60% or more to complete this lesson.
Create a free account to save your progress, take quizzes and earn a certificate.