
PET-350 · Lesson 5 of 12 · 19 min
Density and photoelectric logs
With the shale volume and the true resistivity in hand, Ethan needs porosity. Imogen opens track 3 of the Tamarack 8-27 pilot well print. 'The density log is usually the best single porosity measurement we have,' she says. 'It measures the rock's bulk density very accurately, and if you know the grain density and the fluid density you can turn that into porosity. The catch is that you have to choose the grain density, and the photoelectric curve next to it is how you check whether you chose right.'
This lesson explains how the density tool measures bulk density by gamma-ray scattering, how bulk density converts to porosity, why the choice of matrix density matters, how the photoelectric factor identifies lithology, and what borehole conditions and fluids do to the readings.
How the density tool works
The density tool is a pad pressed against the borehole wall. It carries a sealed gamma-ray source, usually caesium-137, and two detectors at different distances from it. Gamma rays leaving the source collide with electrons in the formation and lose energy in each collision, a process called Compton scattering. The more electrons the rock contains per unit volume, the more scattering occurs and the fewer gamma rays reach the detectors. The count rates therefore measure the formation's electron density, which for most rock-forming minerals and fluids is closely proportional to the ordinary bulk density.
The short-spaced detector is more sensitive to the mud cake and any gap between pad and wall; the long-spaced detector reads further into the rock. Comparing the two allows the tool to correct for mud cake and small standoff. This correction appears on the print as a separate curve, often labeled the density correction. Small values, a few hundredths of a gram per cubic centimeter or a few tens of kilograms per cubic meter, show good pad contact. Large values mean the measurement is unreliable.
The density tool reads only a few centimeters, a few inches, into the formation, so it sees the flushed zone. Its vertical resolution is good, around 30 to 45 cm, or a foot to a foot and a half, with high-resolution processing giving finer detail.
From bulk density to porosity
The measured bulk density is a volume-weighted average of the grain density and the fluid density.
Here ρma is the matrix, or grain, density and ρf is the density of the fluid the tool sees, which in the flushed zone is mostly mud filtrate. Density logs record grams per cubic centimeter: quartz is about 2.65 g/cm³, calcite about 2.71 g/cm³ and dolomite about 2.87 g/cm³, and fresh filtrate is close to 1.00 g/cm³.
# Density porosity with different matrix choices, and lithology from the photoelectric factor
SI = False
if SI:   # kg/m3
    rho_f, unit = 1000.0, "kg/m3"
    mats = {"sandstone": 2650.0, "limestone": 2710.0, "dolomite": 2870.0}
    rhob = 2420.0
else:    # g/cm3
    rho_f, unit = 1.00, "g/cm3"
    mats = {"sandstone": 2.65, "limestone": 2.71, "dolomite": 2.87}
    rhob = 2.42
print(f"bulk density {rhob} {unit}, fluid density {rho_f} {unit}")
for name, rma in mats.items():
    phi = (rma - rhob) / (rma - rho_f)
    print(f"  {name:10s} matrix {rma:7.2f}: density porosity {phi * 100:5.1f} %")
pe_ref = {"quartz sandstone": 1.8, "dolomite": 3.1, "limestone": 5.1, "anhydrite": 5.1, "barite mud effect": 267.0}
for pe in (1.9, 3.0, 4.9):
    near = min((abs(pe - v), k) for k, v in pe_ref.items() if v < 10)[1]
print(f"Pe = {pe:.1f} barns/electron reads closest to {near}")bulk density 2.42 g/cm3, fluid density 1.0 g/cm3 sandstone matrix 2.65: density porosity 13.9 % limestone matrix 2.71: density porosity 17.0 % dolomite matrix 2.87: density porosity 24.1 % Pe = 1.9 barns/electron reads closest to quartz sandstone Pe = 3.0 barns/electron reads closest to dolomite Pe = 4.9 barns/electron reads closest to anhydrite
The same bulk density of 2.42 g/cm³ gives 13.9 percent porosity if the rock is sandstone, 17.0 percent if it is limestone and 24.1 percent if it is dolomite. The matrix choice is therefore not a detail; it is often the largest single uncertainty in density porosity. Log prints often display porosity computed on a limestone or sandstone matrix for convenience, and the interpreter must recompute it with the correct matrix for the actual rock.
For the middle Bakken at the Tamarack 8-27 pilot well, core grain densities from the 8-27 core average about 2.70 g/cm³, above pure quartz because the rock contains dolomite cement and some feldspar. Imogen uses that value rather than 2.65 g/cm³. The difference changes porosity by about three porosity units at these low porosities, which can decide whether an interval passes the pay cutoff.
The fluid density and hydrocarbon effects
The fluid density in the equation is the density of the fluid in the flushed zone, not in the uninvaded rock. In a water zone or an oil zone flushed by water-based filtrate, using the filtrate density close to that of fresh or slightly salty water is usually adequate. In a gas zone, residual gas in the flushed zone lowers the fluid density and therefore the bulk density, so density porosity reads too high. Light oil has a smaller effect. Lesson 6 shows how combining density with neutron porosity both detects gas and corrects for it.
Salty filtrate is denser than fresh water, and heavy oil-based mud filtrate is lighter, so the fluid density must be set from the mud system. The effect is usually small compared with the matrix uncertainty.
The photoelectric factor
Modern density tools also measure the photoelectric factor, Pe, from the low-energy part of the gamma-ray spectrum. At low energies, gamma rays are absorbed by the photoelectric effect, and the absorption depends very strongly on the atomic number of the atoms present. Pe is measured in barns per electron and is almost independent of porosity, because the pore fluids have very low values. It is therefore an excellent lithology indicator.
| Mineral | Pe (barns/electron) | Grain density |
|---|---|---|
| Quartz | about 1.8 | 2.65 g/cm³ |
| Dolomite | about 3.1 | 2.87 g/cm³ |
| Calcite | about 5.1 | 2.71 g/cm³ |
| Anhydrite | about 5.1 | 2.98 g/cm³ |
| Halite | about 4.7 | 2.04 g/cm³ |
| Pyrite | about 17 | 5.0 g/cm³ |
| Barite | about 267 | 4.5 g/cm³ |
A Pe near 1.8 indicates quartz sandstone, near 3 dolomite, and near 5 limestone or anhydrite, which the density then separates. Mixtures read in between. Pe crossplotted with bulk density gives a quick estimate of mineral proportions in two-mineral systems, and it is used with neutron and sonic data in more complex multi-mineral models.
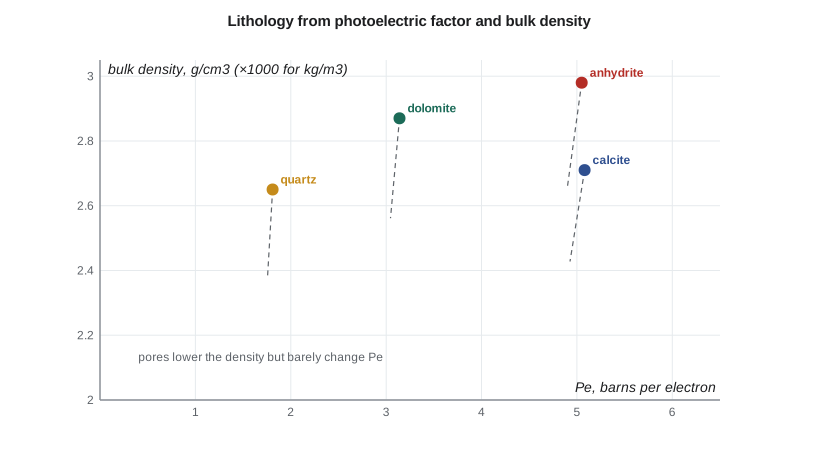
Pe has limitations. It is a very shallow measurement and is strongly affected by barite in the mud. A heavy mud weighted with barite leaves barite-rich mud cake, and the Pe then reads very high regardless of the rock. In such wells Pe is often discarded. Heavy minerals such as pyrite also raise Pe, and some feldspars and micas behave unexpectedly, so Pe is best used together with core mineralogy.
Borehole and quality problems
Because the density tool is a pad, it depends on contact with the borehole wall. In washed-out hole, the pad may lose contact and read the mud, giving a low bulk density and a false high porosity. In rugose hole with small cavities, readings become noisy. The density correction curve and the caliper reveal these problems. Where the hole is poor over the reservoir, porosity from neutron or sonic logs, or from nuclear magnetic resonance, may be more reliable.
The source must also be considered in planning. The density source is radioactive and is handled under the licensing rules described in lesson 1. If a density tool becomes stuck, the source becomes the key concern in recovery planning.
Using density porosity
Across the middle Bakken in the Tamarack 8-27 pilot well, the density correction is small and the caliper is close to bit size, so Imogen trusts the density. With the core grain density and a filtrate density of 1.00 g/cm³, bulk densities of 2.55 to 2.60 g/cm³ in the main reservoir give porosities of 6 to 9 percent. The Pe curve reads between 2 and 3, confirming a mixture of quartz and dolomite, and jumps above 3 in thin beds that the core shows are tightly dolomite-cemented with almost no porosity.
Worked problem
Density porosity
A sandstone with a grain density of 2.65 g/cm³ reads a bulk density of 2.38 g/cm³. The filtrate density is 1.05 g/cm³. Find the density porosity.
Show solution
- Porosity = (2.65 − 2.38)/(2.65 − 1.05) = 0.27/1.60.
- Porosity = 0.169.
Answer: The density porosity is about 16.9 percent. Using a fresh-water fluid density instead would give 16.4 percent.
Lithology from density and Pe together
Bulk density and Pe can be combined into a quantity that is almost independent of porosity, the volumetric photoelectric absorption U, which is Pe multiplied by the electron density. Because U adds linearly by volume, a two-mineral mixture with known porosity can be solved for the fraction of each mineral. Plotted against an apparent matrix density computed from density and neutron, U separates quartz, calcite, dolomite and anhydrite clearly on the matrix identification plot. This is how many multi-mineral evaluations of carbonates, and of mixed sandstones with dolomite cement such as the middle Bakken, are started.
In practice, Imogen's team uses the Pe mainly as a quick check. Readings near 2 mean the matrix density chosen for sandstone is reasonable. Readings near 3 in a rock assumed to be sandstone warn that dolomite is present and that the matrix density should be raised. Readings near 5 warn of calcite or anhydrite cement. Each warning prompts a look at the core description and, where available, X-ray diffraction mineralogy.
Density in LWD and in horizontal wells
LWD density tools sit in a drill collar that rotates, so the detectors sweep around the borehole. They record density in several sectors around the hole, which allows the tool to choose the sector with the best wall contact, usually the bottom of the hole in a horizontal well where the collar rests. The sector data also produce density images, which show bed boundaries crossed by the well and help geosteering. Because LWD density is recorded soon after drilling, invasion is shallow and the hole is usually in better condition than it will be days later, though tool standoff in enlarged hole can still degrade the readings.
Sources of error in density porosity
It is useful to list the error sources in order of size. The matrix density usually dominates; an error of 0.02 g/cm³, or 20 kg/m³, changes porosity by more than a porosity unit. Poor pad contact and mud cake come next and can be large but are usually flagged by the density correction. Fluid density errors from gas or unusual filtrate follow. Statistical noise from the gamma-ray counts is a few tenths of a porosity unit at normal logging speeds. Shale in the rock affects density porosity according to the shale's own density, which may be higher or lower than the matrix; in shaly sands a shale correction is applied using the shale volume from lesson 3. Knowing which error dominates tells the interpreter where to spend effort: here, on getting the matrix density right from core.
A worked check on matrix choice
Ethan tests the effect of matrix choice on one sample before accepting the core value. With the bulk density from the log and three candidate matrix densities, sandstone, the core average and a dolomite-rich value, porosity changes by several units. He then plots the core grain densities against depth and finds that they rise toward the base of the reservoir, where dolomite cement increases. Rather than use one value for the whole interval, he uses a grain density that varies with depth according to the core trend, smoothed to log resolution. The porosity curve that results matches the core porosities within about half a porosity unit over the full interval, which is as good as the measurements themselves allow. Simple checks like this, made before the main calculation, prevent the most common and most expensive porosity errors.
Common mistakes
MistakeUsing the default matrix density on the print for every rock.
InsteadChoose the matrix from core grain densities or from Pe and other logs.
MistakeTrusting density porosity in washed-out hole.
InsteadCheck the caliper and density correction; flag or replace readings where pad contact is lost.
MistakeUsing Pe in barite-weighted mud.
InsteadBarite mud cake dominates Pe; rely on other lithology indicators.
MistakeForgetting the gas effect on density porosity.
InsteadGas lowers bulk density and raises density porosity; combine with the neutron.
MistakeUsing uninvaded-zone fluid density.
InsteadThe density tool sees the flushed zone, so use the filtrate density.
Summary and key terms
- The density tool measures electron density by Compton scattering of gamma rays from a sealed source.
- Two detectors allow a mud-cake correction; large corrections mean poor data.
- Density porosity depends on the matrix and fluid densities, and the matrix choice is often the largest uncertainty.
- The photoelectric factor depends strongly on atomic number and identifies lithology almost independently of porosity.
- Barite mud ruins Pe, and washouts ruin the density.
- Gas lowers bulk density and makes density porosity read too high.
- Bulk density
- The density of the rock including its pore fluids.
- Matrix density
- The density of the rock grains, without pores.
- Compton scattering
- Loss of gamma-ray energy in collisions with electrons.
- Photoelectric factor (Pe)
- A measure of low-energy gamma-ray absorption that indicates lithology.
- Density correction
- The correction for mud cake and standoff computed from two detectors.
- Density porosity
- Porosity calculated from bulk density with chosen matrix and fluid densities.
Practice problems
Work each problem on paper first, then reveal the answer to check.
Why is Pe almost independent of porosity?
Show answer
Pore fluids have very low photoelectric absorption.
What does a large density correction indicate?
Show answer
Poor pad contact or thick mud cake; the reading is unreliable.
Which mineral has a Pe near 3?
Show answer
Dolomite.
Does gas make density porosity read high or low?
Show answer
High.
Lesson quiz · 5 questions
Score 60% or more to complete this lesson.
Create a free account to save your progress, take quizzes and earn a certificate.