
PET-250 · Lesson 8 of 12 · 18 min
Relative permeability
The development plan for the conventional sandstone above the Bakken calls for a waterflood, while the Bakken itself will rely on primary depletion and perhaps gas injection later. In both cases the question is how two or three fluids share the pores as they flow. As pressure in the Bakken falls below the bubble point, gas comes out of solution, and the oil must flow alongside it. 'Permeability tells us how easily one fluid flows,' Lena says. 'When two fluids flow together, each gets in the other's way. Relative permeability tells us how much.'
Effective and relative permeability
Absolute permeability, k, describes flow when the rock is fully saturated with one fluid. When two or more fluids are present, each flows through only part of the pore network, and the interfaces between them add resistance. The permeability to each fluid in the presence of the others is its effective permeability, ko for oil, kw for water and kg for gas. Each depends on saturation. Dividing effective permeability by a reference permeability, usually the absolute permeability or the oil permeability at irreducible water saturation, gives relative permeability, a number between 0 and 1.
Darcy's law applies to each phase separately with its effective permeability and its own viscosity and pressure gradient. Relative permeabilities usually add to less than one: when two fluids share the pores, the total ability to conduct flow is less than when one fluid fills them, because each phase blocks parts of the network and the interfaces trap fluid.
The shape of the curves
For an oil-water system, relative permeability curves are plotted against water saturation. The oil curve starts at its maximum, the end-point kro at irreducible water saturation, and falls as water saturation rises, reaching zero at residual oil saturation, 1 − Sor, where the remaining oil is trapped in disconnected droplets. The water curve starts at zero at irreducible water saturation, because the remaining water is immobile in films and small pores, and rises to its end-point krw at residual oil saturation. The range of saturation between the end points, 1 − Swi − Sor, is the movable saturation range, and the oil within it is the target of a waterflood.
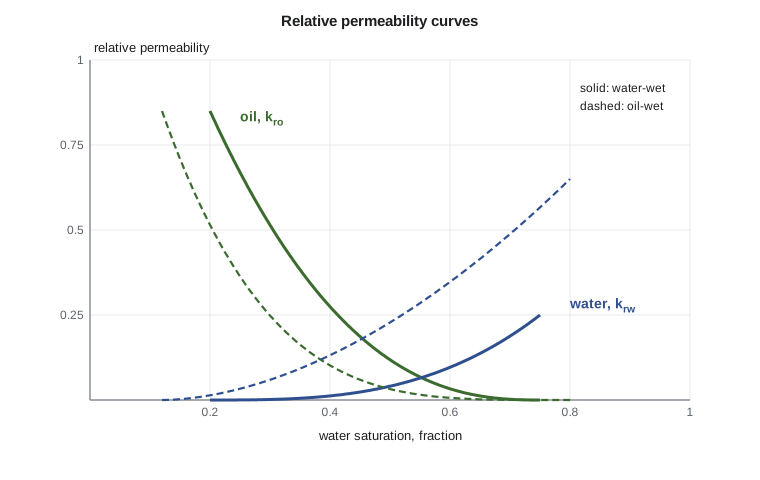
The shape of the curves reflects wettability. In a water-wet rock, water occupies the small pores and coats the grains, so it flows poorly: the water end-point is low, often 0.1 to 0.3, and the curves cross at a water saturation above 0.5. Oil, occupying the large pores, flows well until it is trapped. In an oil-wet rock the roles reverse: water occupies the large pore centers and flows easily, the water end-point is higher, often 0.5 or more, and the curves cross at water saturations below 0.5. Craig's rules of thumb, published in 1971, summarize these differences and are still used to sanity-check laboratory data, though mixed-wet rocks often fall in between.
| Feature | Water-wet | Oil-wet |
|---|---|---|
| Irreducible water saturation | usually above 0.20 | usually below 0.15 |
| Crossover water saturation | above 0.50 | below 0.50 |
| Water end-point krw | below about 0.3 | above about 0.5 |
| Residual oil saturation | moderate, with sharp trapping | often lower but reached only after much water |
Measuring relative permeability
In the steady-state method, oil and water are injected together at a fixed ratio until the pressure drop and the saturation stop changing, then the effective permeabilities are calculated from Darcy's law for each phase. The ratio is changed and the process repeated to build the curves point by point. Saturation is found by weighing the plug or by X-ray or gamma-ray scanning. The method is slow, taking days per point, but it is easy to interpret.
In the unsteady-state method, a plug at irreducible water saturation is flooded with water, and the volumes of oil and water produced and the pressure drop are recorded over time. The Johnson-Bossler-Naumann method, or more commonly today history matching with a numerical simulator, then calculates the relative permeability curves that would reproduce the data. Unsteady-state tests are fast but are affected by capillary end effects: at the outlet face, capillary pressure holds back the wetting phase, distorting saturations near the end of the plug. Laboratories reduce the problem with long cores, high flow rates or simulation that includes capillary pressure. Centrifuge methods measure the relative permeability of the displaced phase near its end point.
Measurements must use representative wettability, as lesson 6 explained, and rates that match reservoir conditions. Different laboratories often report different curves for the same rock, which is why engineers check data with Craig's rules, compare against analog fields, and treat the curves as uncertain inputs.
Corey and Brooks-Corey models
For simulation, measured relative permeability data are usually fitted with simple equations. The Corey model expresses each curve as a power of normalized water saturation, the fraction of the movable range that is filled with water.
The end points and the Corey exponents describe the curves completely. Exponents near 2 are typical for oil in water-wet rock; water exponents of 2 to 4 are common in water-wet rock and lower in oil-wet rock. Brooks and Corey, in 1964, linked the exponents to the pore size distribution index from capillary pressure data, giving a physical basis for the model. The LET model, a more flexible three-parameter form, is popular when Corey curves cannot fit the data.
Fractional flow and the Buckley-Leverett front
When oil and water flow together, the fraction of the flowing stream that is water, the fractional flow fw, depends on their mobilities, each phase's relative permeability divided by its viscosity. Ignoring gravity and capillary pressure, fractional flow depends only on saturation.
In 1942, Buckley and Leverett showed that in a linear waterflood each water saturation travels through the reservoir at a speed proportional to the slope of the fractional flow curve at that saturation. This creates a sharp front: ahead of it the rock is at its original saturation, and behind it water saturation rises gradually. Welge, in 1952, showed that the saturation at the front is found by drawing a tangent to the fractional flow curve from the initial water saturation. The point where the tangent touches the curve gives the front saturation, and extending the tangent to fw = 1 gives the average water saturation behind the front at breakthrough, which fixes how much oil has been recovered when water first reaches the producer.
# Corey relative permeability, fractional flow and the Buckley-Leverett front (Welge tangent)
Swc, Sor = 0.20, 0.25
krw_max, kro_max, nw, no = 0.30, 0.85, 3.0, 2.0
mu_w, mu_o = 0.5, 2.0                         # cP (mPa.s) at reservoir conditions

def kr(sw):
    s = min(max((sw - Swc) / (1 - Swc - Sor), 0.0), 1.0)   # normalized saturation
    return krw_max * s ** nw, kro_max * (1 - s) ** no
def fw(sw):
    krw, kro = kr(sw)
    return 1.0 if kro == 0 else (krw / mu_w) / (krw / mu_w + kro / mu_o)

print("  Sw    krw    kro    fw")
for sw in (0.20, 0.30, 0.40, 0.50, 0.60, 0.70, 0.75):
    a, b = kr(sw)
    print(f"{sw:5.2f} {a:6.3f} {b:6.3f} {fw(sw):6.3f}")
M = (krw_max / mu_w) / (kro_max / mu_o)
print(f"end-point mobility ratio M = {M:.2f}")

# Welge: tangent from (Swc, 0) to the fw curve gives the front saturation
best, swf = 0.0, Swc
for i in range(1, 1000):
    sw = Swc + i * (1 - Swc - Sor) / 1000
    slope = fw(sw) / (sw - Swc)
    if slope > best: best, swf = slope, sw
sw_bar = Swc + 1 / best                      # average saturation behind the front at breakthrough
print(f"front saturation {swf:.3f}, fw at front {fw(swf):.3f}")
print(f"oil recovered at water breakthrough: {(sw_bar - Swc) / (1 - Swc):.0%} of the oil in place")
print(f"movable oil swept at breakthrough: {(sw_bar - Swc) / (1 - Swc - Sor):.0%}")Sw krw kro fw 0.20 0.000 0.850 0.000 0.30 0.002 0.569 0.013 0.40 0.014 0.344 0.144 0.50 0.049 0.176 0.526 0.60 0.115 0.063 0.880 0.70 0.225 0.007 0.992 0.75 0.300 0.000 1.000 end-point mobility ratio M = 1.41 front saturation 0.600, fw at front 0.880 oil recovered at water breakthrough: 57% of the oil in place movable oil swept at breakthrough: 83%
Mobility ratio
The end-point mobility ratio, M, compares the mobility of water behind the front with the mobility of oil ahead of it.
When M is 1 or less, the displacement is stable: water advances as a fairly uniform front, sweeping the rock efficiently. When M is much greater than 1, the more mobile water fingers through the oil, breaking through early and leaving large unswept areas. Viscous oil gives high mobility ratios, which is why heavy oil waterfloods recover little oil and why engineers add polymer to thicken injected water or use steam to thin the oil. In the program's example, M is 1.4, a mildly unfavorable ratio that still gives a sharp front and recovers more than half the oil in place by the time water breaks through in a one-dimensional displacement. Real reservoirs recover less, because heterogeneity and well patterns leave parts of the rock unswept.
Worked problem
Water cut at a producing well
At the producer, water saturation in the reservoir has risen to 0.55. Using Corey parameters Swi = 0.20, Sor = 0.25, krw⁰ = 0.30, kro⁰ = 0.85, nw = 3, no = 2, μw = 0.5 cP and μo = 2.0 cP, estimate the water cut, ignoring gravity and capillary pressure.
Show solution
- Swn = (0.55 − 0.20)/(1 − 0.20 − 0.25) = 0.35/0.55 = 0.636.
- krw = 0.30 × 0.636³ = 0.30 × 0.257 = 0.0772.
- kro = 0.85 × (1 − 0.636)² = 0.85 × 0.132 = 0.112.
- Mobilities: water 0.0772/0.5 = 0.154; oil 0.112/2.0 = 0.0562.
- fw = 0.154/(0.154 + 0.0562) = 0.73.
Answer: The well produces about 73 percent water at reservoir conditions even though the rock still holds 45 percent oil. This is why waterfloods spend most of their life at high water cut, and why the water-handling capacity of surface facilities is a major design decision.
Three-phase and gas-oil relative permeability
When gas is present with oil and water, as in solution gas drive below the bubble point or during gas injection, three phases share the pores. Gas-oil relative permeability is measured in the laboratory with gas displacing oil at irreducible water saturation. Gas does not flow until its saturation exceeds the critical gas saturation, typically 2 to 10 percent, after which gas relative permeability rises quickly because gas is the least viscous fluid. Producing gas-oil ratios rise sharply once gas becomes mobile, which is why solution gas drive recovers only 5 to 25 percent of the oil in place. Three-phase relative permeability is rarely measured directly; simulators estimate it from two-phase curves using models such as Stone's methods, first published in 1970 and 1973.
Hysteresis
Relative permeability depends on saturation history as well as saturation. A drainage curve, measured as oil displaces water, differs from an imbibition curve, measured as water displaces oil, because some oil becomes trapped during imbibition. The trapped gas in a gas cap invaded by water, or the gas in an injection cycle, follows the same rule. Simulation models that switch between injection and production need hysteresis models, such as the Land trapping relation, to represent these differences.
Common mistakes
MistakeUsing absolute permeability for each phase in multiphase flow.
InsteadMultiply absolute permeability by each phase's relative permeability at the current saturation.
MistakeAssuming oil and water relative permeabilities add to one.
InsteadThey usually add to less than one because each phase blocks the other.
MistakeUsing relative permeability measured on cleaned core in a mixed-wet reservoir.
InsteadRestore wettability first, or the curves will be too water-wet.
MistakeIgnoring capillary end effects in unsteady-state tests.
InsteadUse long cores, high rates or simulation that includes capillary pressure to interpret the data.
Summary and key terms
- Relative permeability is effective permeability to a phase divided by a reference permeability; it depends on saturation and wettability.
- Oil-water curves run between irreducible water saturation and residual oil saturation; their end points and shapes reflect wettability.
- Steady-state, unsteady-state and centrifuge methods measure relative permeability; results need representative wettability and careful interpretation.
- Corey models fit curves with end points and exponents for simulation.
- Fractional flow, the Buckley-Leverett front, the Welge tangent and the mobility ratio predict waterflood performance.
- Effective permeability
- The permeability of a rock to one fluid when other fluids are present.
- Relative permeability
- Effective permeability divided by a reference permeability, ranging from 0 to 1.
- End point
- The value of a relative permeability curve at irreducible water or residual oil saturation.
- Corey exponent
- The power that describes the curvature of a Corey relative permeability curve.
- Fractional flow
- The fraction of the total flowing stream made up of one phase, usually water.
- Mobility ratio
- The mobility of the displacing fluid divided by the mobility of the displaced fluid.
- Critical gas saturation
- The gas saturation at which gas first becomes mobile.
Practice problems
Work each problem on paper first, then reveal the answer to check.
Swi = 0.25, Sor = 0.30, Sw = 0.45. Find the normalized water saturation.
Show answer
Swn = 0.20/0.45 = 0.444.
krw⁰ = 0.4, kro⁰ = 0.8, μw = 0.5 cP, μo = 10 cP. Find M and comment.
Show answer
M = (0.4/0.5)/(0.8/10) = 0.8/0.08 = 10; strongly unfavorable, expect viscous fingering and early breakthrough.
Relative permeability curves cross at Sw = 0.38 with krw⁰ = 0.65. Is the rock water-wet or oil-wet by Craig's rules?
Show answer
Crossover below 0.5 and high water end point suggest oil-wet.
Why does producing gas-oil ratio rise sharply once gas saturation exceeds the critical value?
Show answer
Gas becomes mobile and, being very low in viscosity, flows far more easily than oil.
Lesson quiz · 5 questions
Score 60% or more to complete this lesson.
Create a free account to save your progress, take quizzes and earn a certificate.